GRID: A Python Package for Field Plot Phenotyping Using Aerial Images
Semi-Automatic Pipeline for Precise Image Extraction
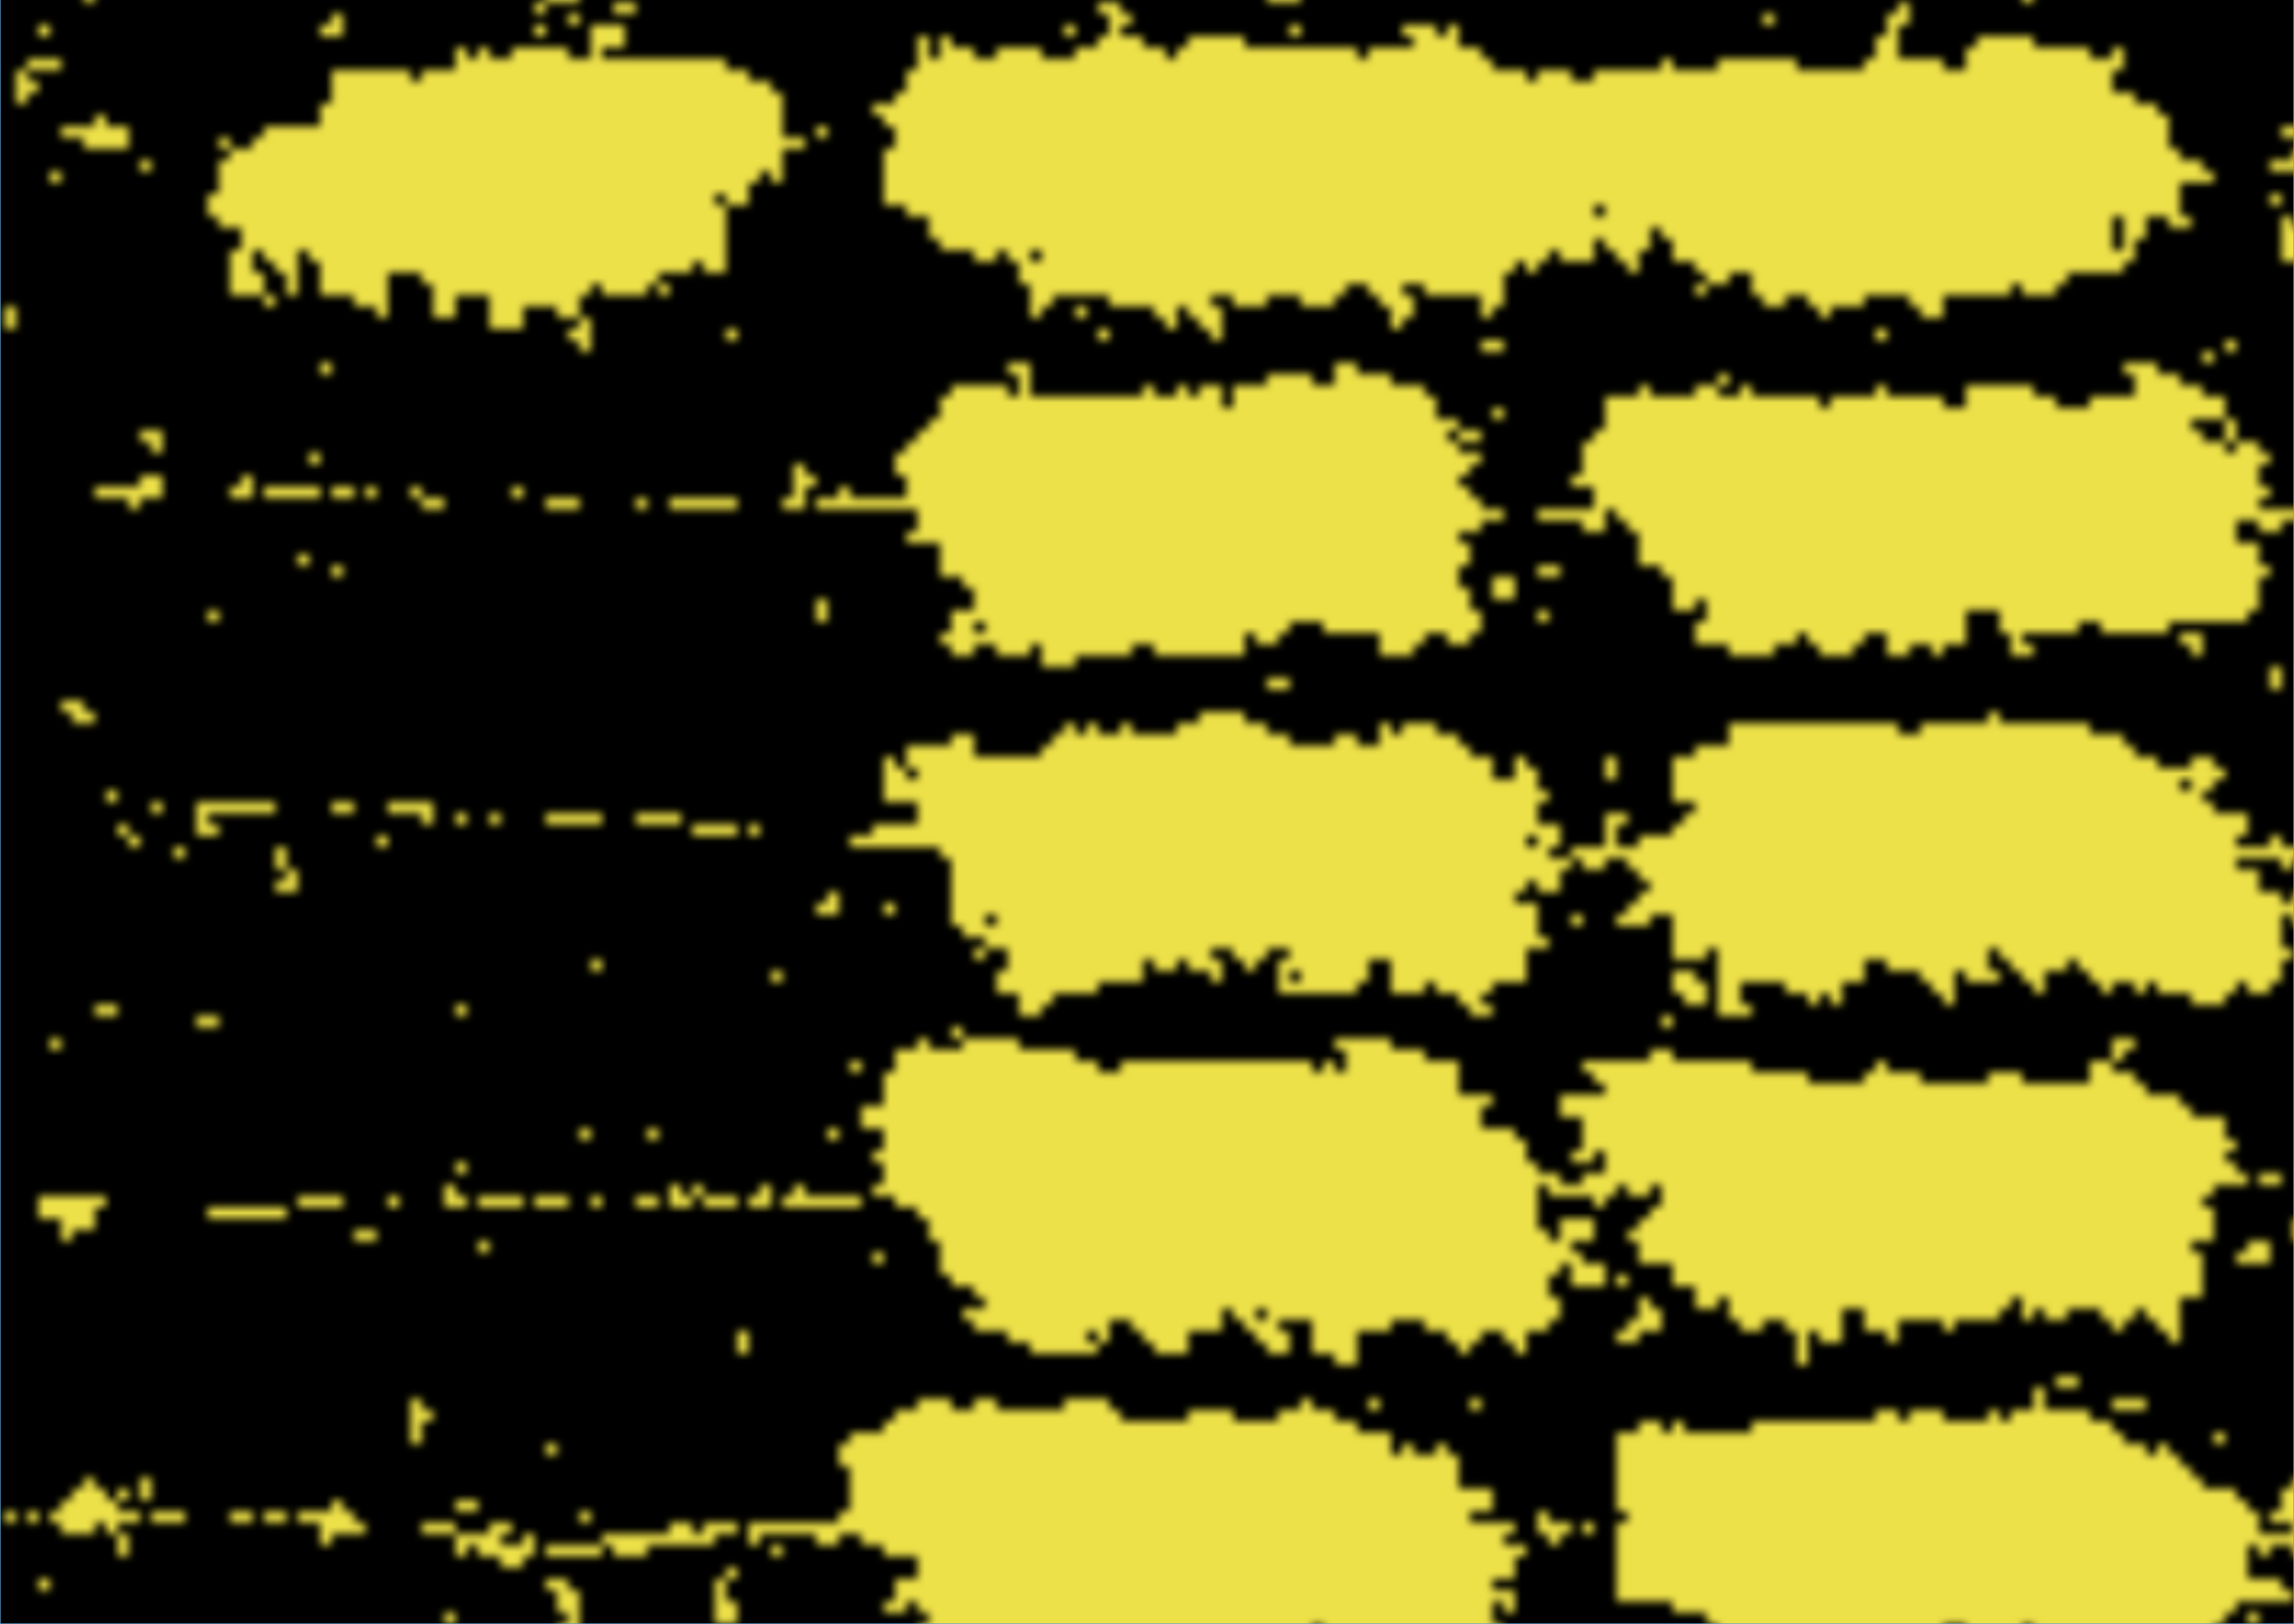
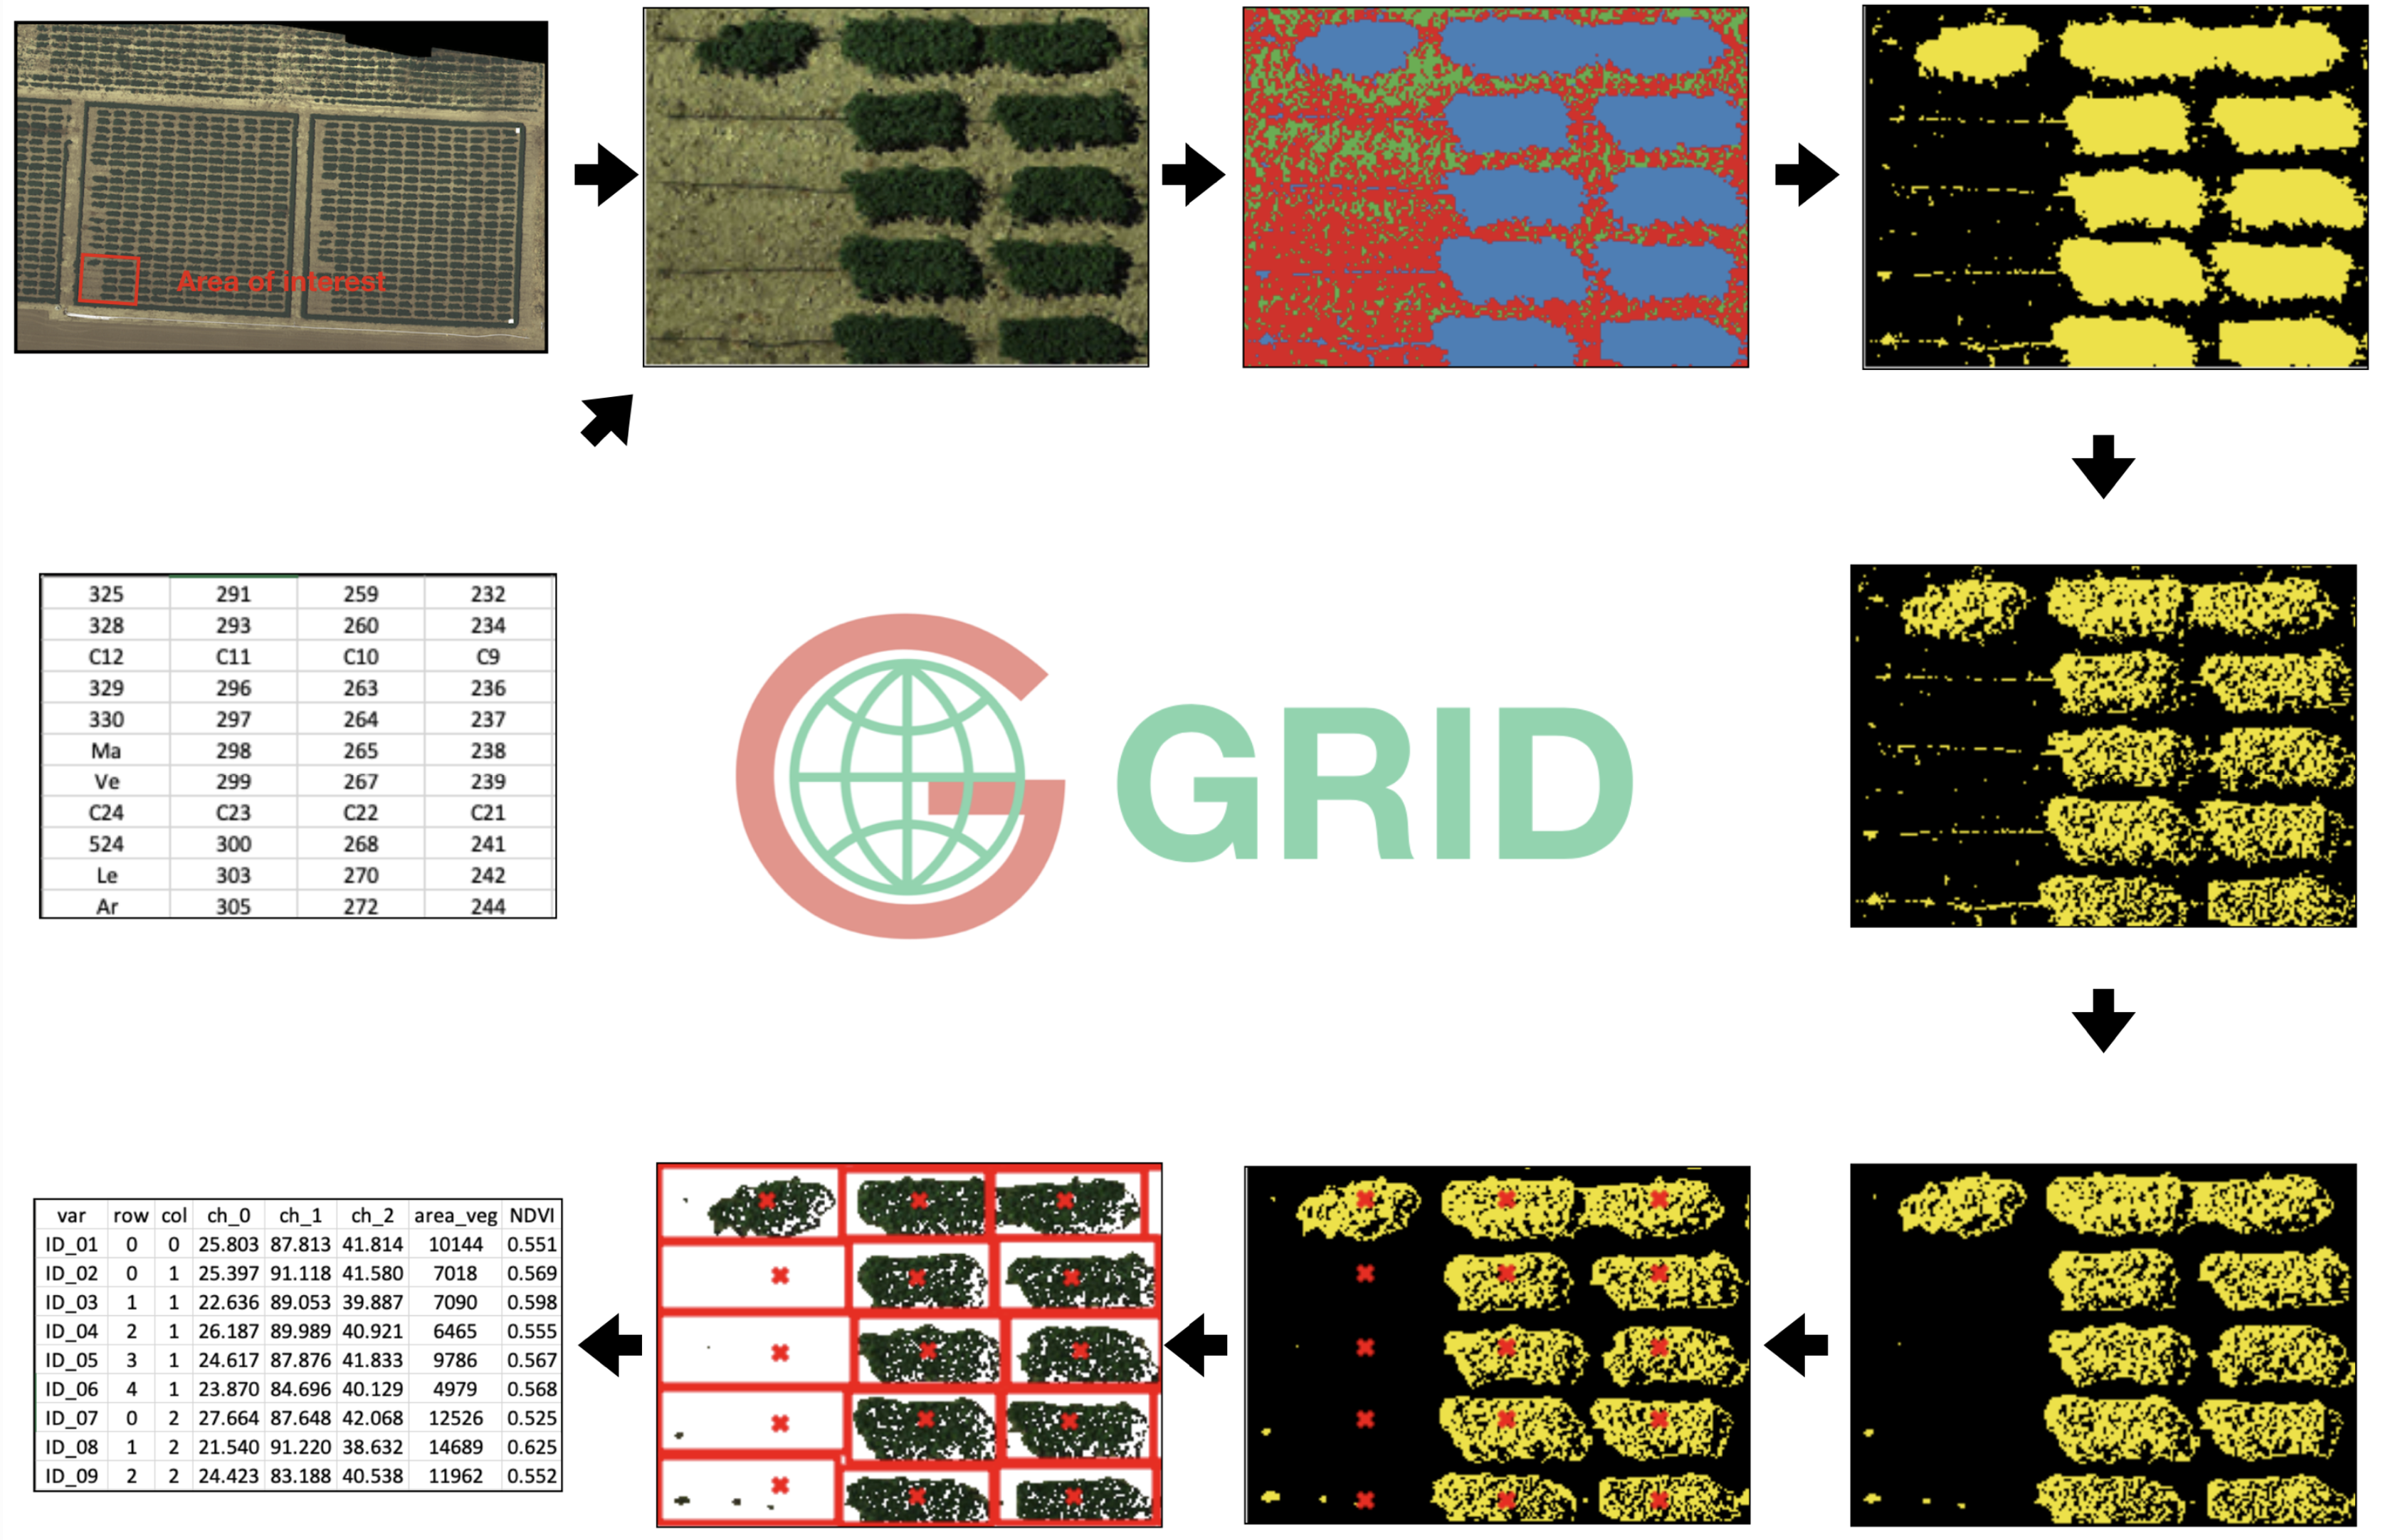
GRID provides a comprehensive workflow that transforms raw aerial images into actionable plot-level vegetation indices (such as NDVI) and morphological metrics in a single software environment. The pipeline offers highly customizable options for refining the extraction process; users can define specific 'Pixels of Interest' (POI) via pixel-wise K-means clustering and apply specific thresholds to remove irrelevant background elements—such as soil, shadows, and irrigation pipes—ensuring that the extracted spectral data accurately represents the crop canopy.
Intuitive GUI for Real-Time Visualization and Efficiency
To ensure extraction precision and ease of use, the software features an interactive Graphical User Interface (GUI) that allows users to adjust segmentation parameters using simple sliders and mouse clicks rather than complex code. This interface provides real-time previews of the segmentation outcomes—such as the identification of vegetation clusters and the calculation of plot boundaries—enabling users to instantly verify the efficiency of the integrated algorithms and visually confirm the accuracy of the data extraction before final export.
Flexibility to Adapt to Diverse Layouts
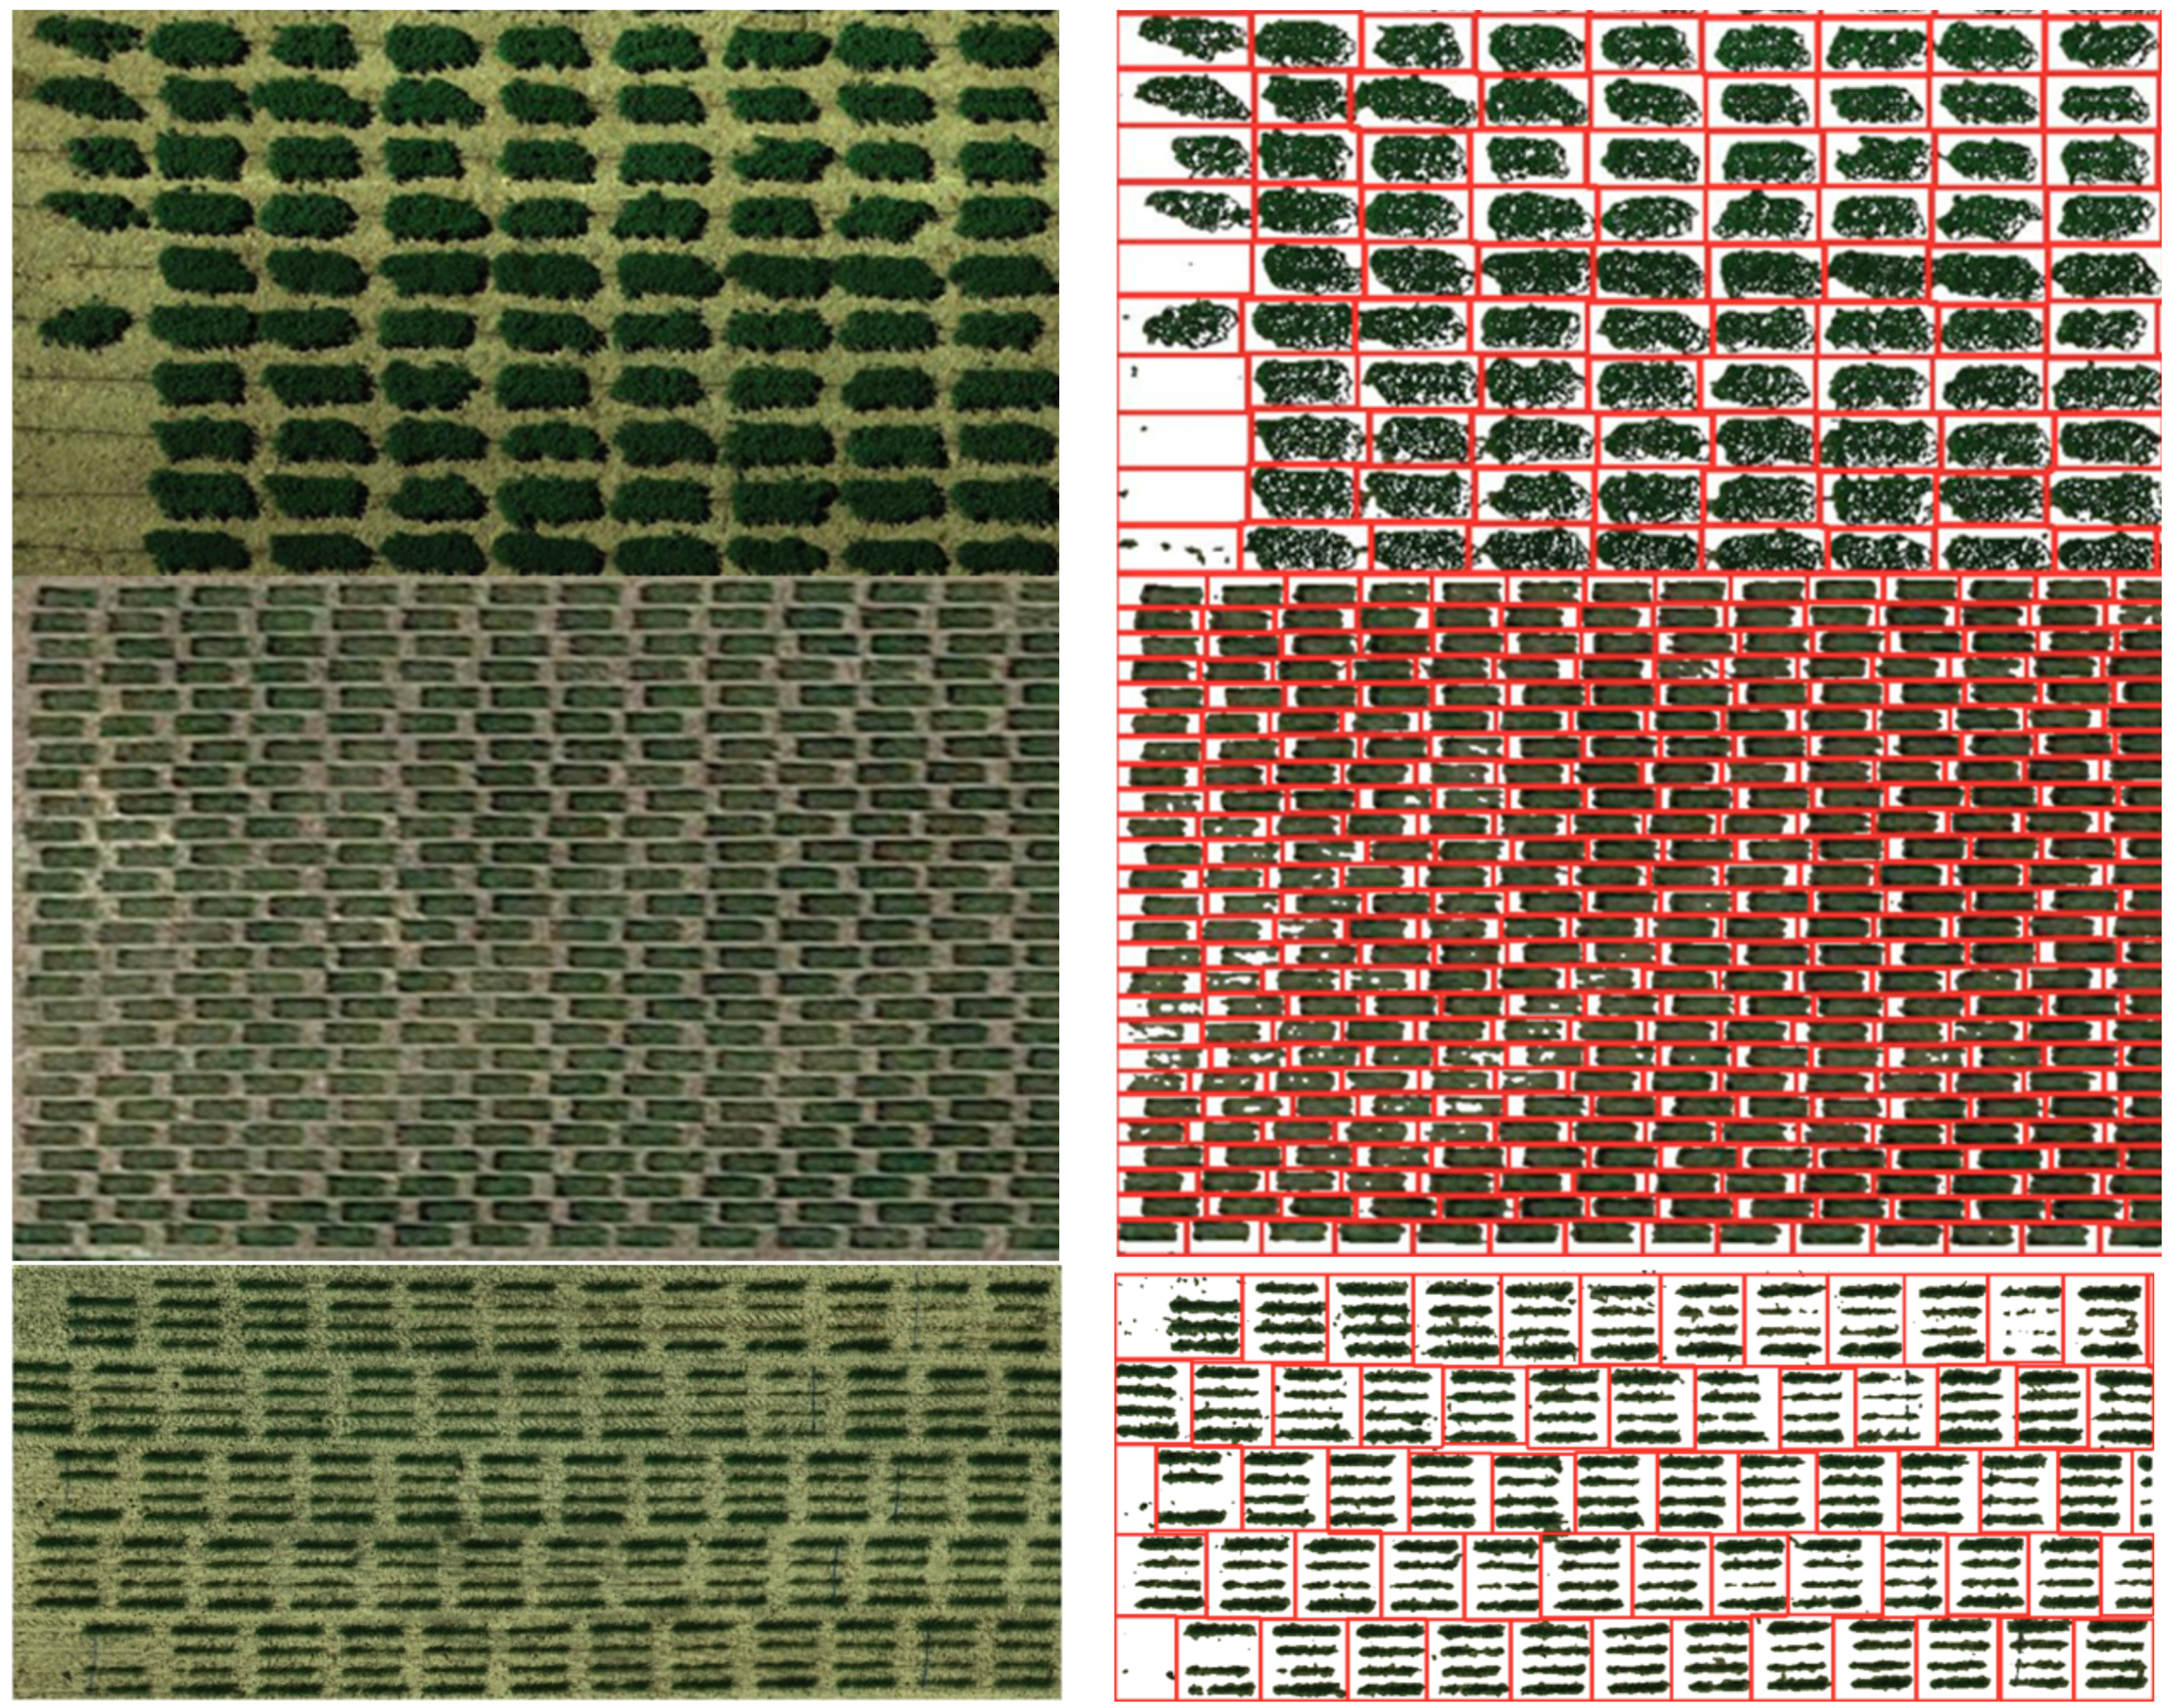
This system is engineered to flexibly adapt to various field experimental designs, including standard rectangles, rhombus shapes, and zigzag patterns. By employing signal analysis and image rotation techniques, the software automatically detects the periodicity and orientation of plot rows and columns, allowing for accurate segmentation even when the field layout involves non-perpendicular angles or varying canopy connections.