An independent validation reveals the potential to predict Hagberg–Perten falling number using spectrometers
Robust Model Evaluation via Multi-Farm Data Collection
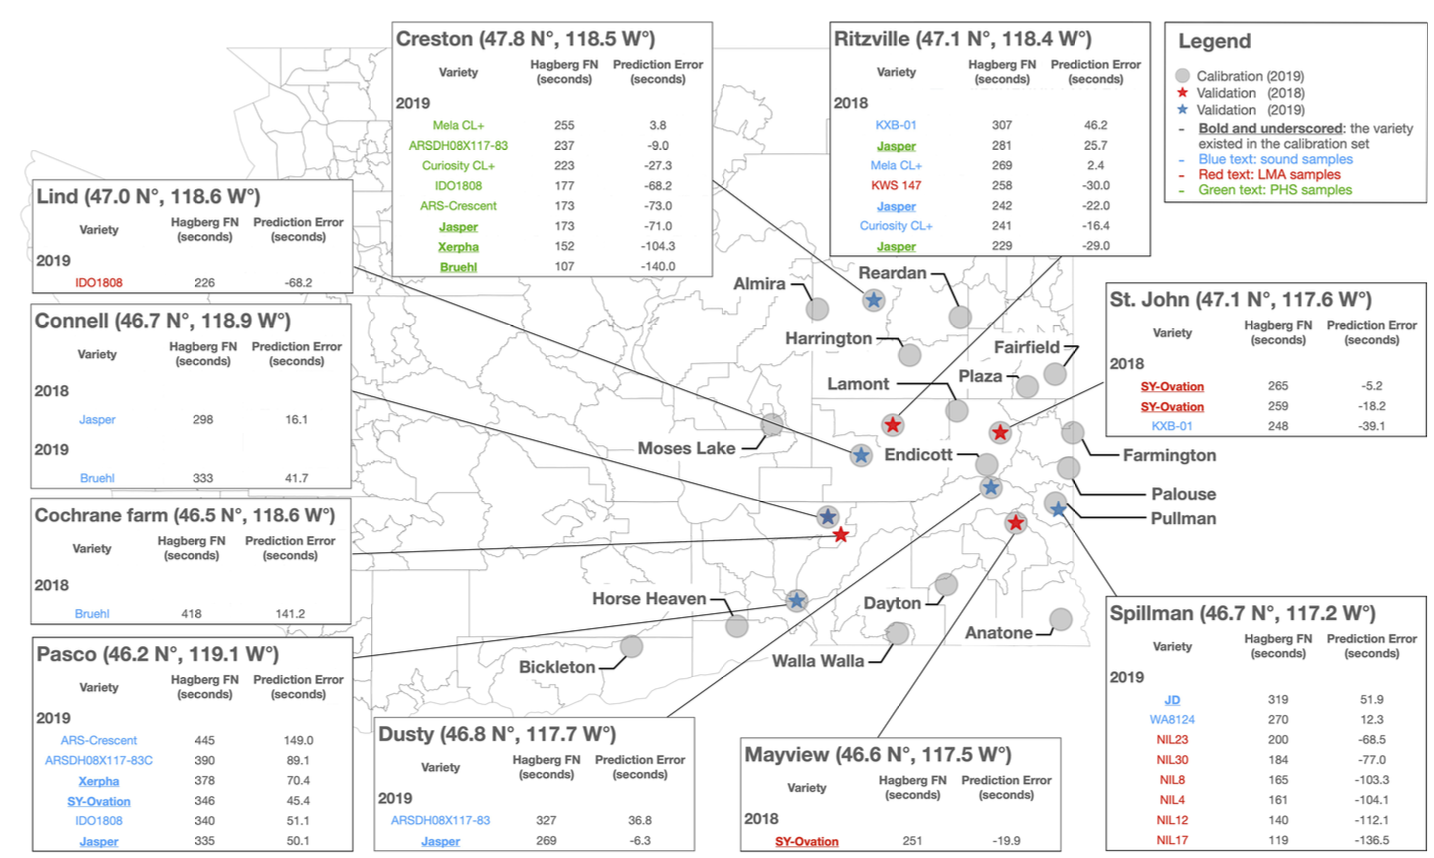
To ensure the prediction model is transferable across different environments rather than just a single homogeneous trial, the study utilized an independent validation dataset collected from 10 distinct locations across Washington State (e.g., Creston, Ritzville, Pasco) over two years. The figure illustrates the geographic distribution of these samples, which covered 19 different wheat varieties and various low-HFN conditions (such as LMA and PHS), allowing researchers to rigorously test the model's performance on data it had never seen before.
Intensive Spectral Band Selection Strategies
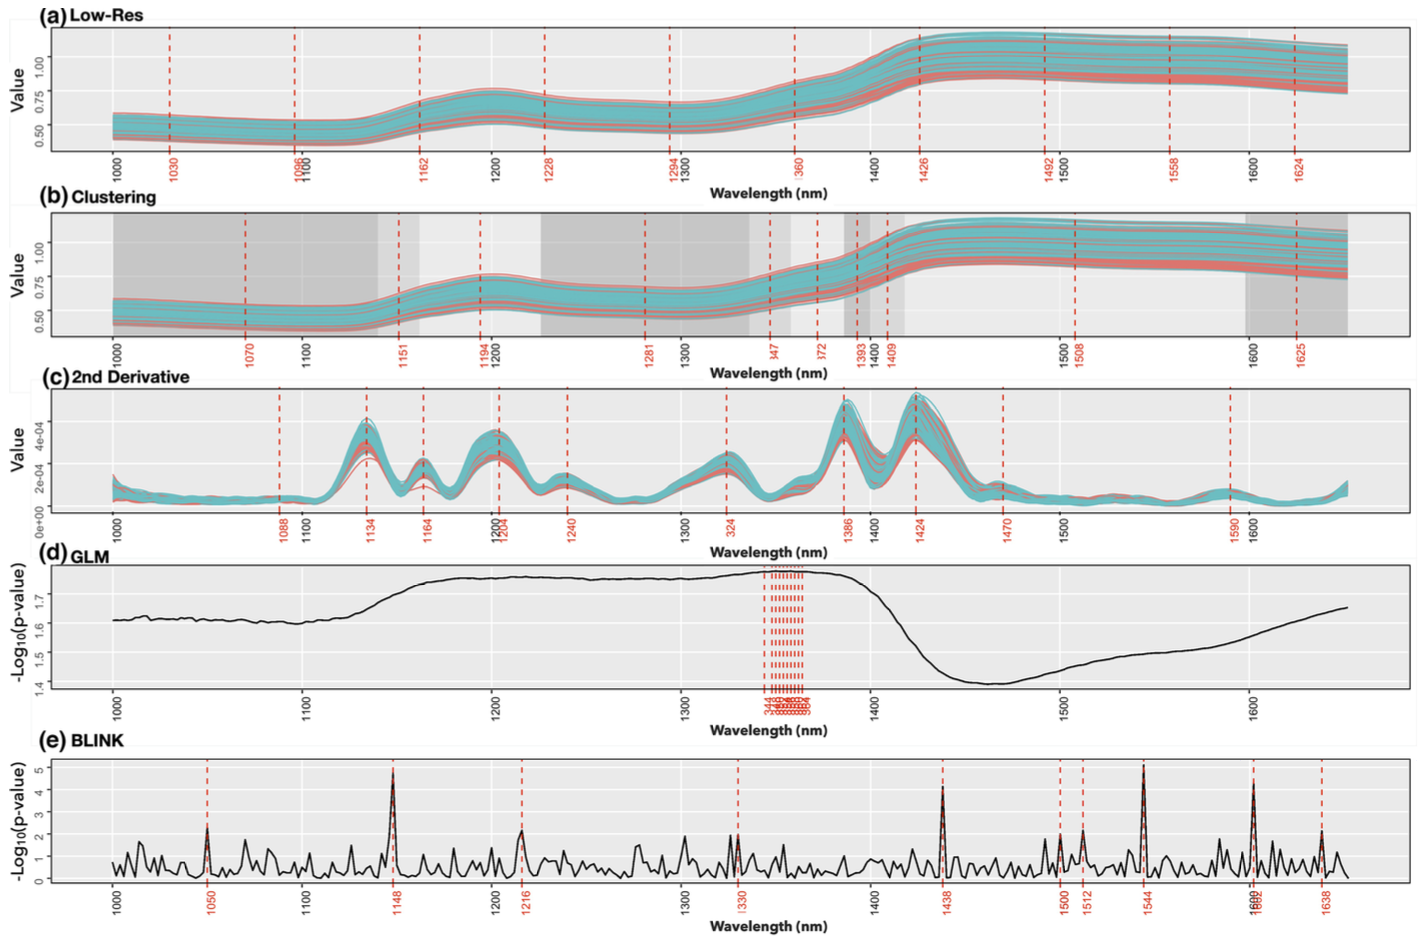
To determine if cost-effective sensors could replace expensive hyperspectral cameras, the study evaluated five feature selection strategies (including GLM, BLINK, and clustering) to identify the most critical 10 spectral bands for prediction. The figure visualizes these selected bands across the 1000–1654 nm range, demonstrating that a reduced model using only a few key wavelengths can achieve prediction accuracy comparable to models using the full spectrum, paving the way for more affordable hardware solutions
Pixel-Level Falling Number Prediction
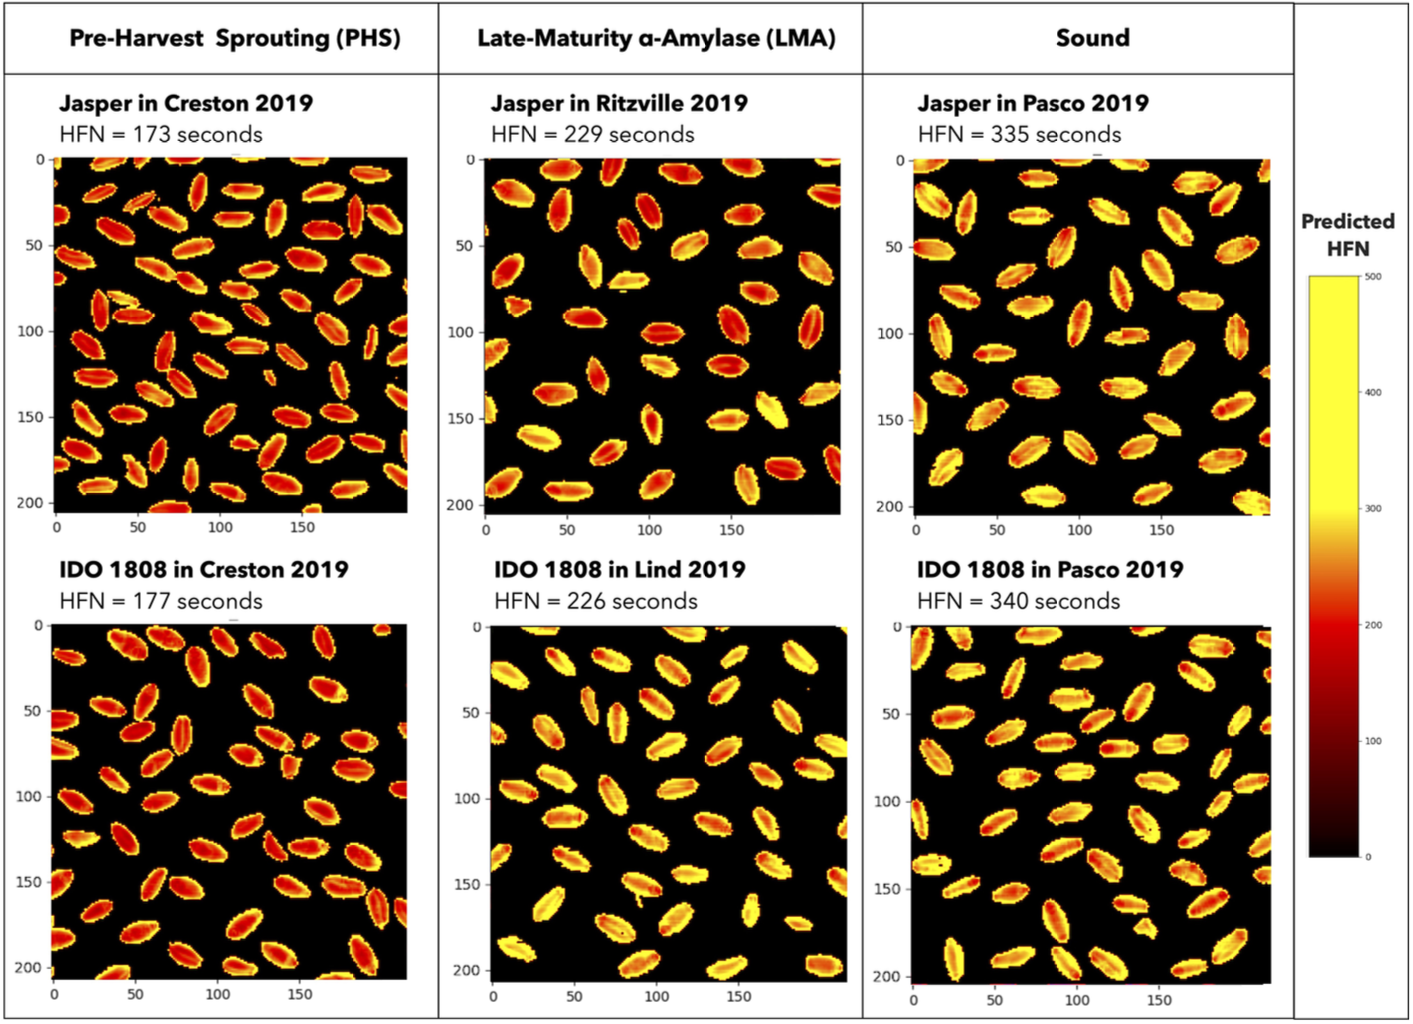
Beyond bulk analysis, the calibrated Partial Least Square Regression (PLSR) model was applied to hyperspectral images to map HFN values at the pixel level, visually revealing spatial patterns associated with specific grain conditions, the figure displays these heatmaps, where red pixels indicate low HFN; this visualization helps distinguish between Pre-Harvest Sprouting (PHS), where low values are scattered, and Late-Maturity Alpha-Amylase (LMA), where low values tend to concentrate near the embryo.