Excel Filtering and Descriptive Statistics
A. Background and Objectives
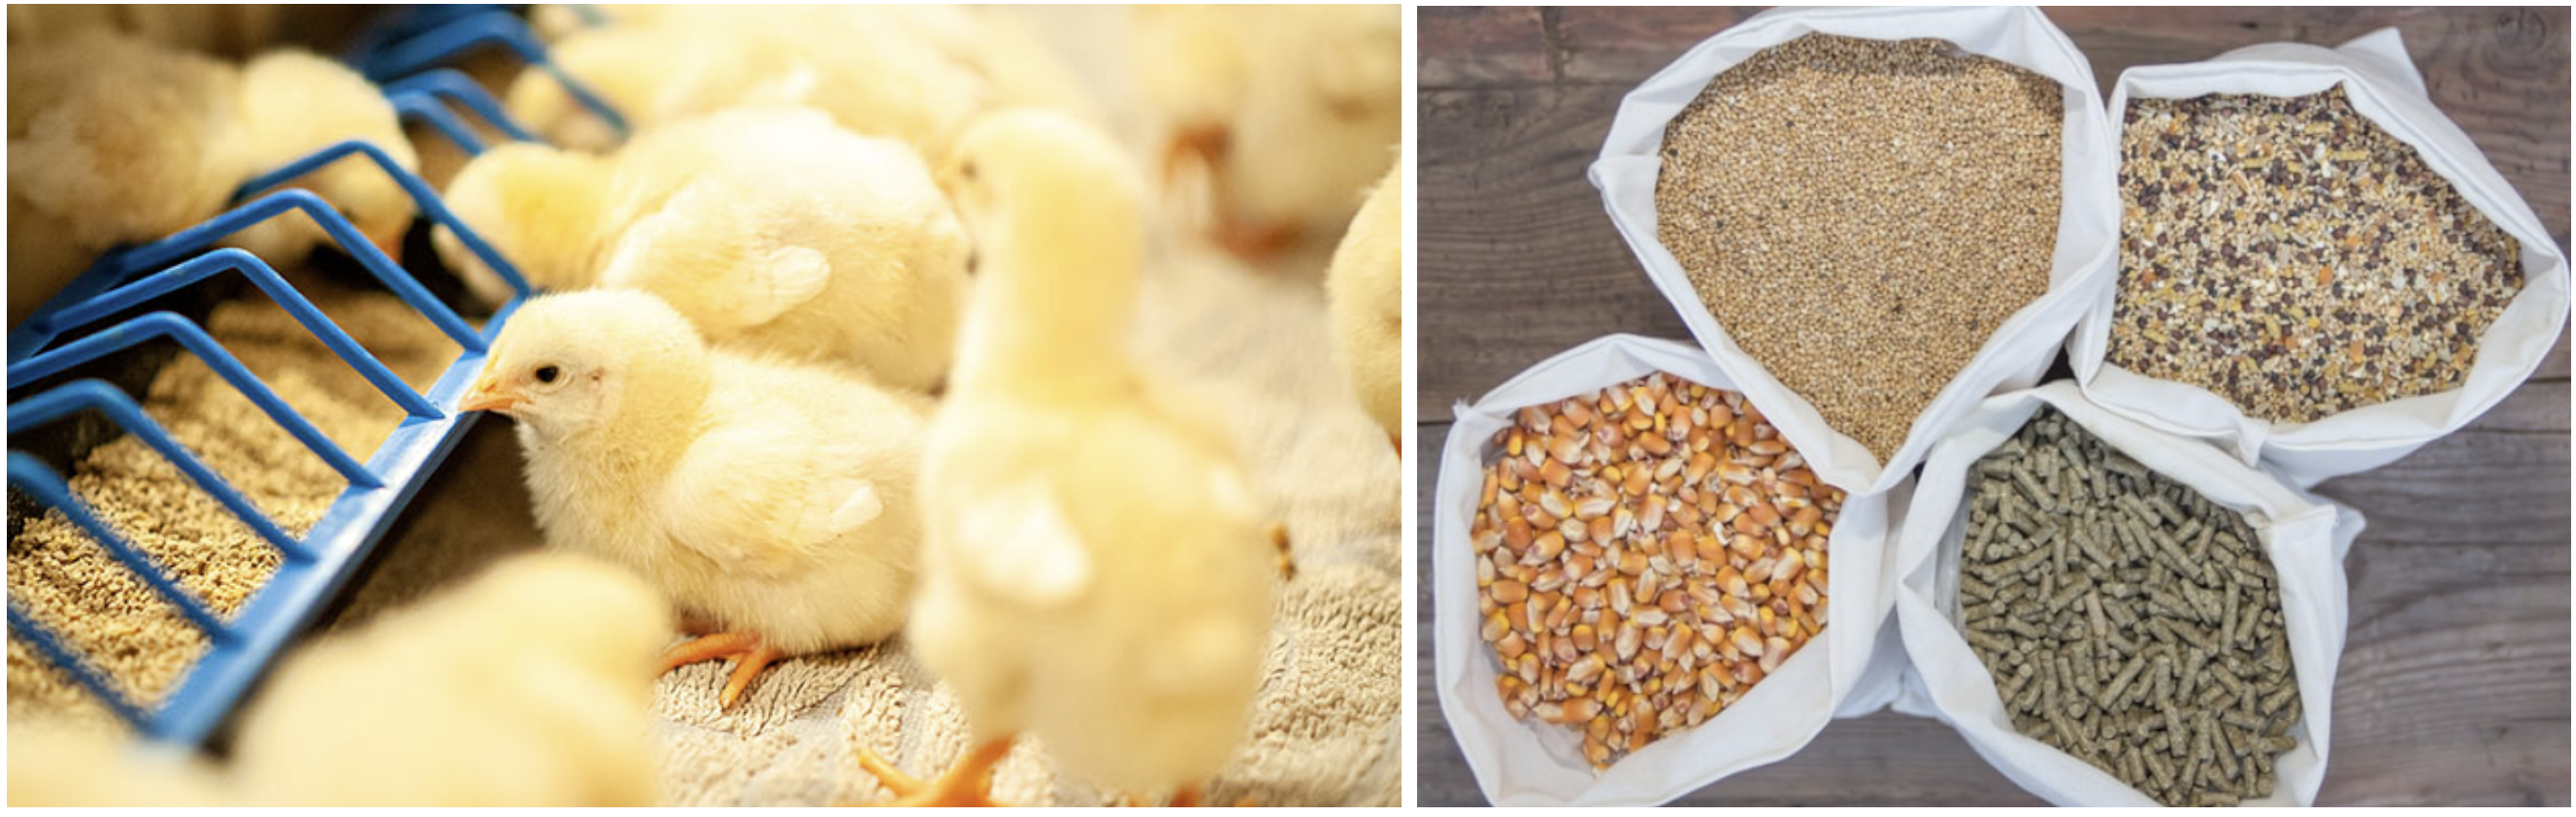
Feed plays a critical role in determining chick growth and weight development. Different diets provide varying amounts of energy, protein, and essential nutrients, which directly influence how quickly and efficiently chicks gain weight. The first 21 days of life are especially important because this is a key growth period when chicks experience rapid muscle and skeletal development.
In this lecture, you will learn how to use Excel and basic statistics to analyze the effects of diet on chick weight distribution over time. We will explore common Excel operations, such as filtering data by specific criteria (e.g., diet type), and calculating descriptive statistics, including the mean, median, and standard deviation.
B. Data Overview
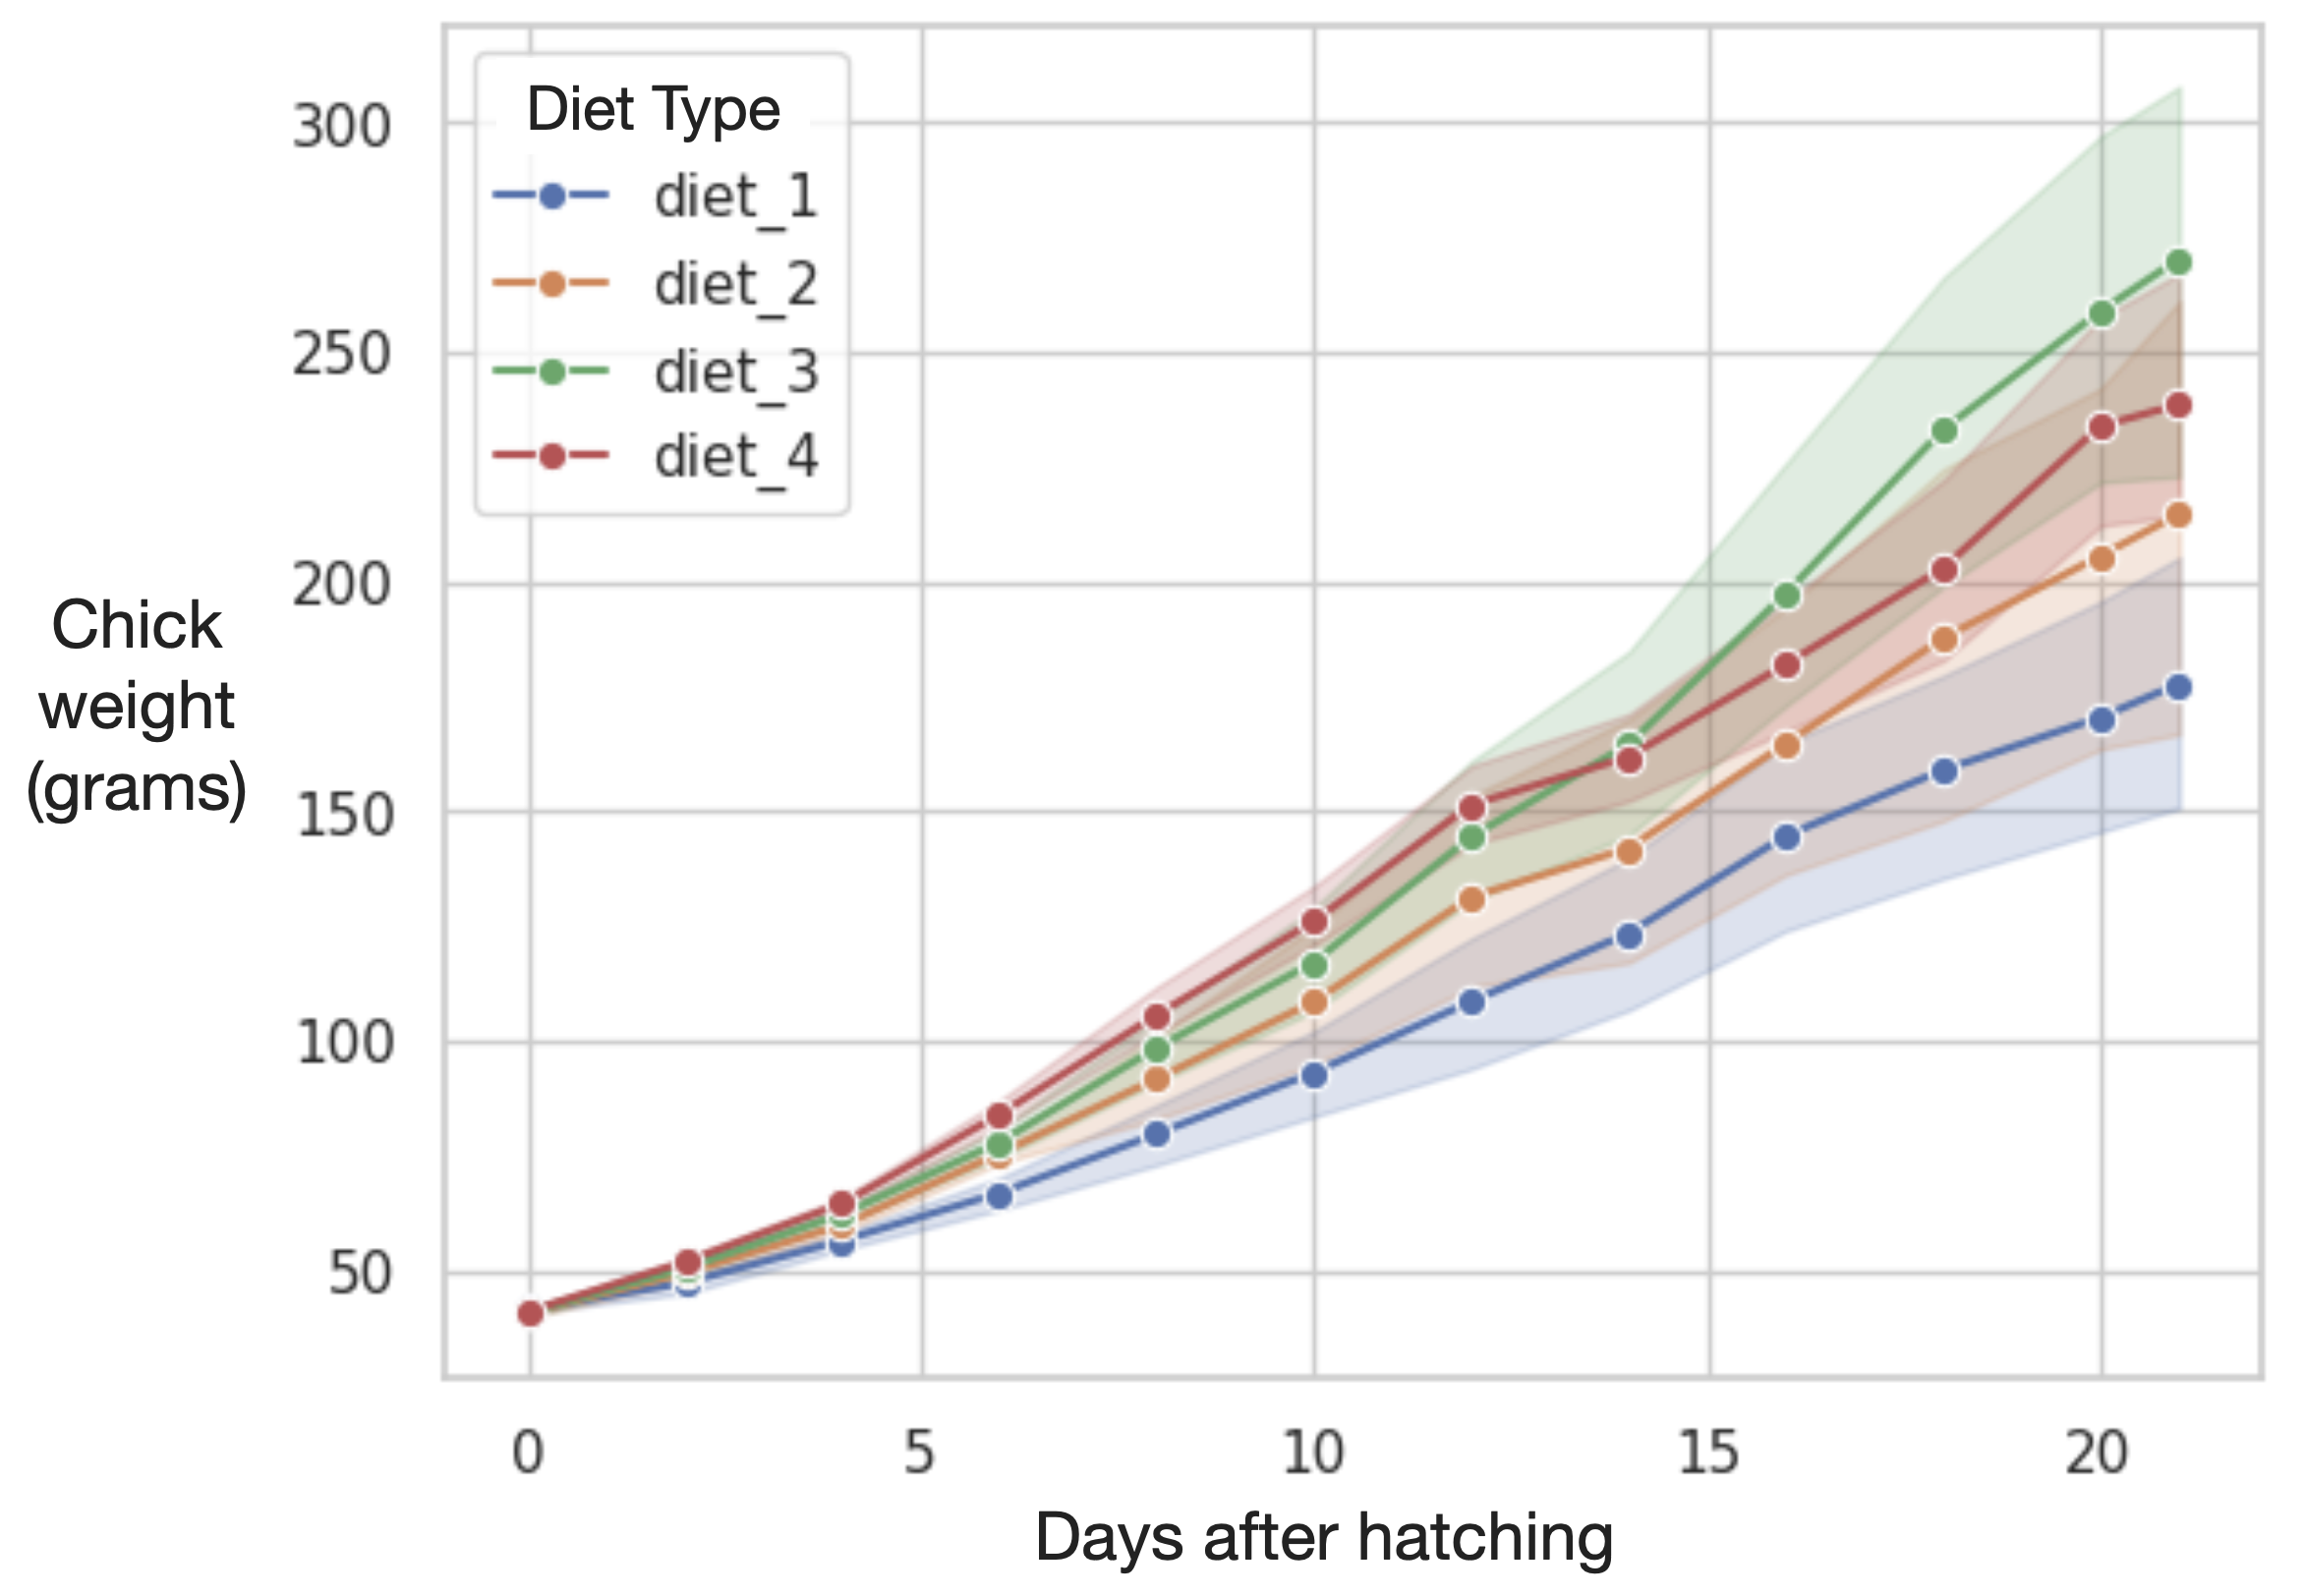
The dataset provided in this lecture tracks the body weight of chicks from 0 to 21 days of age. The data is grouped by diet type (4 diets) and chick ID. The data is visualized in the following figure.
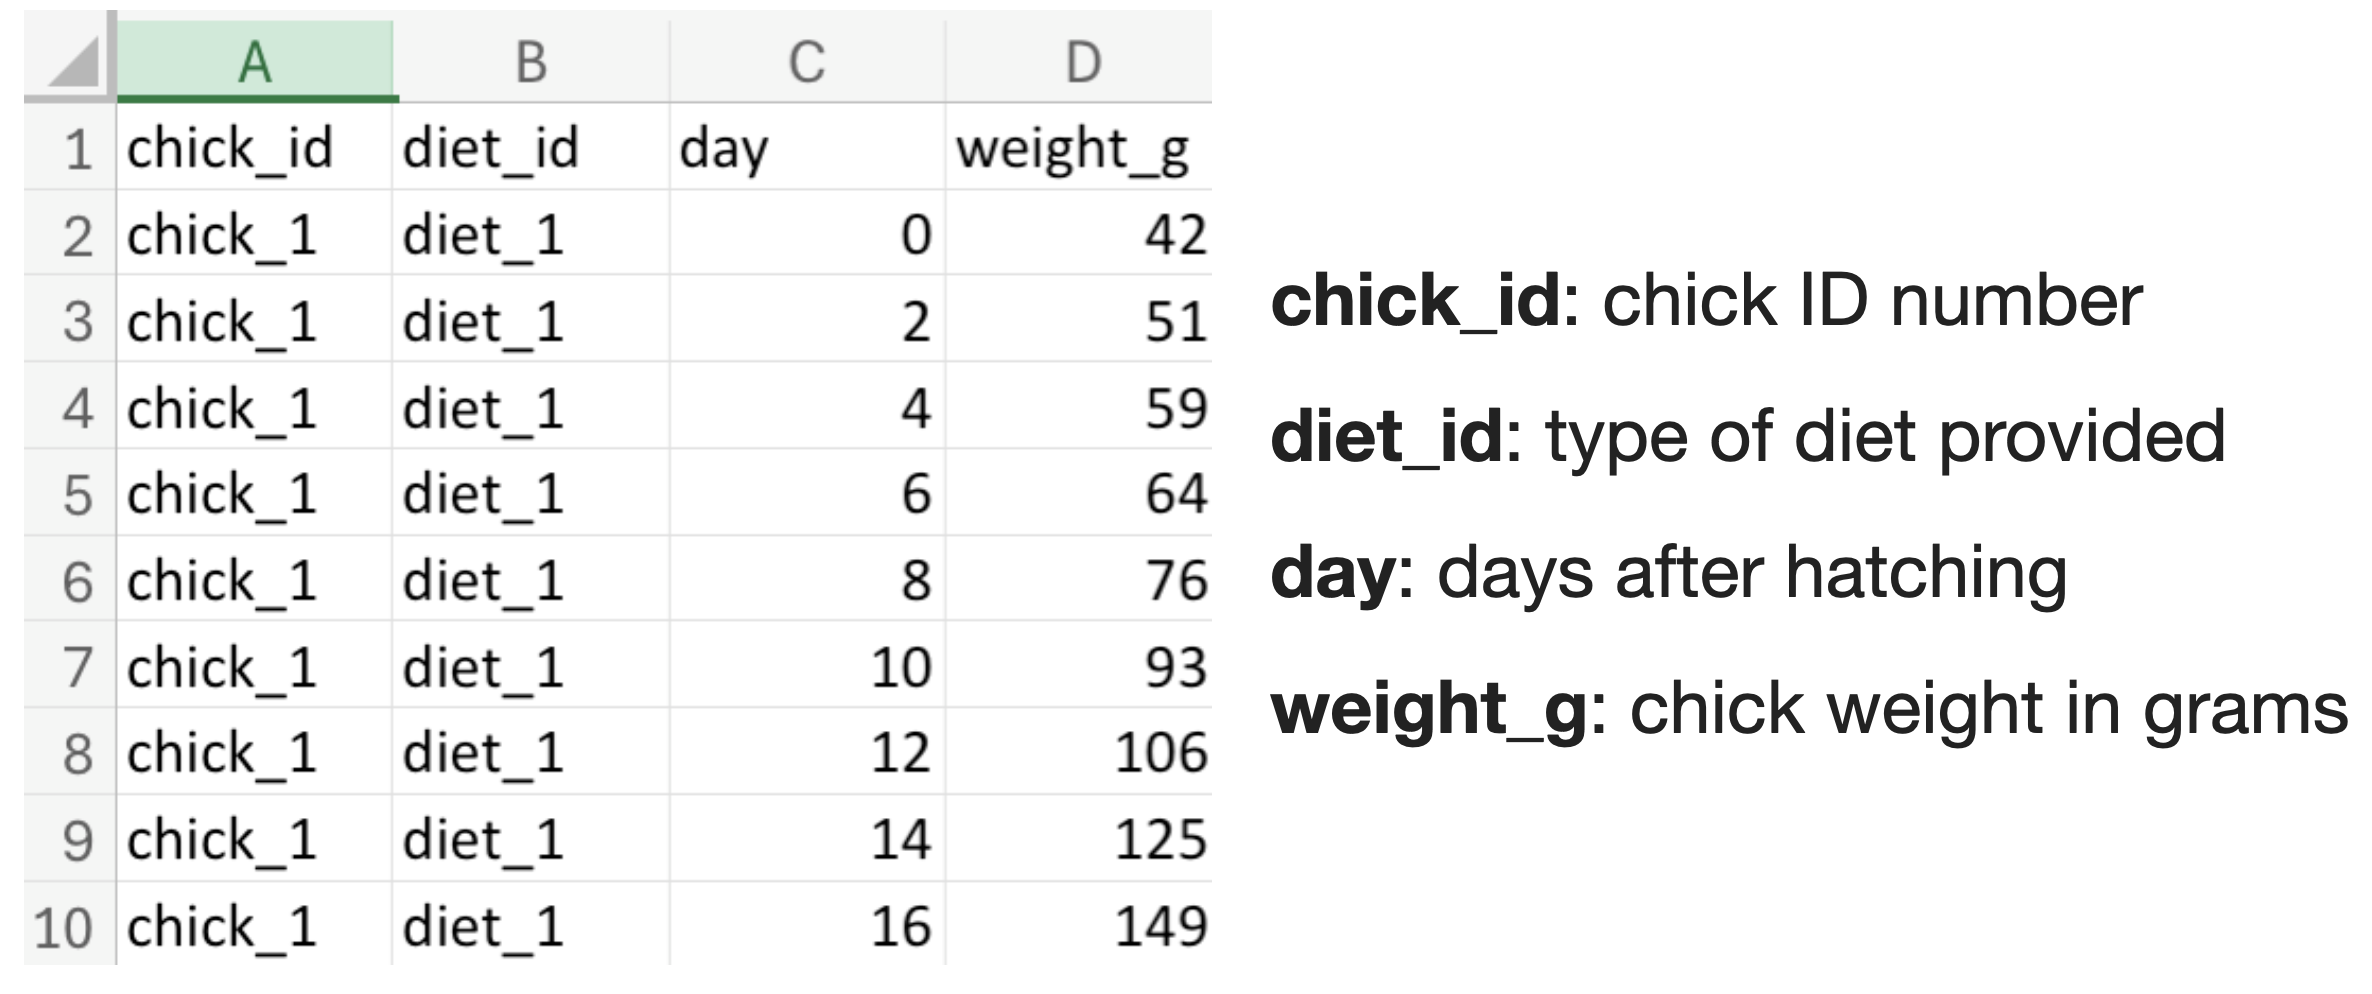
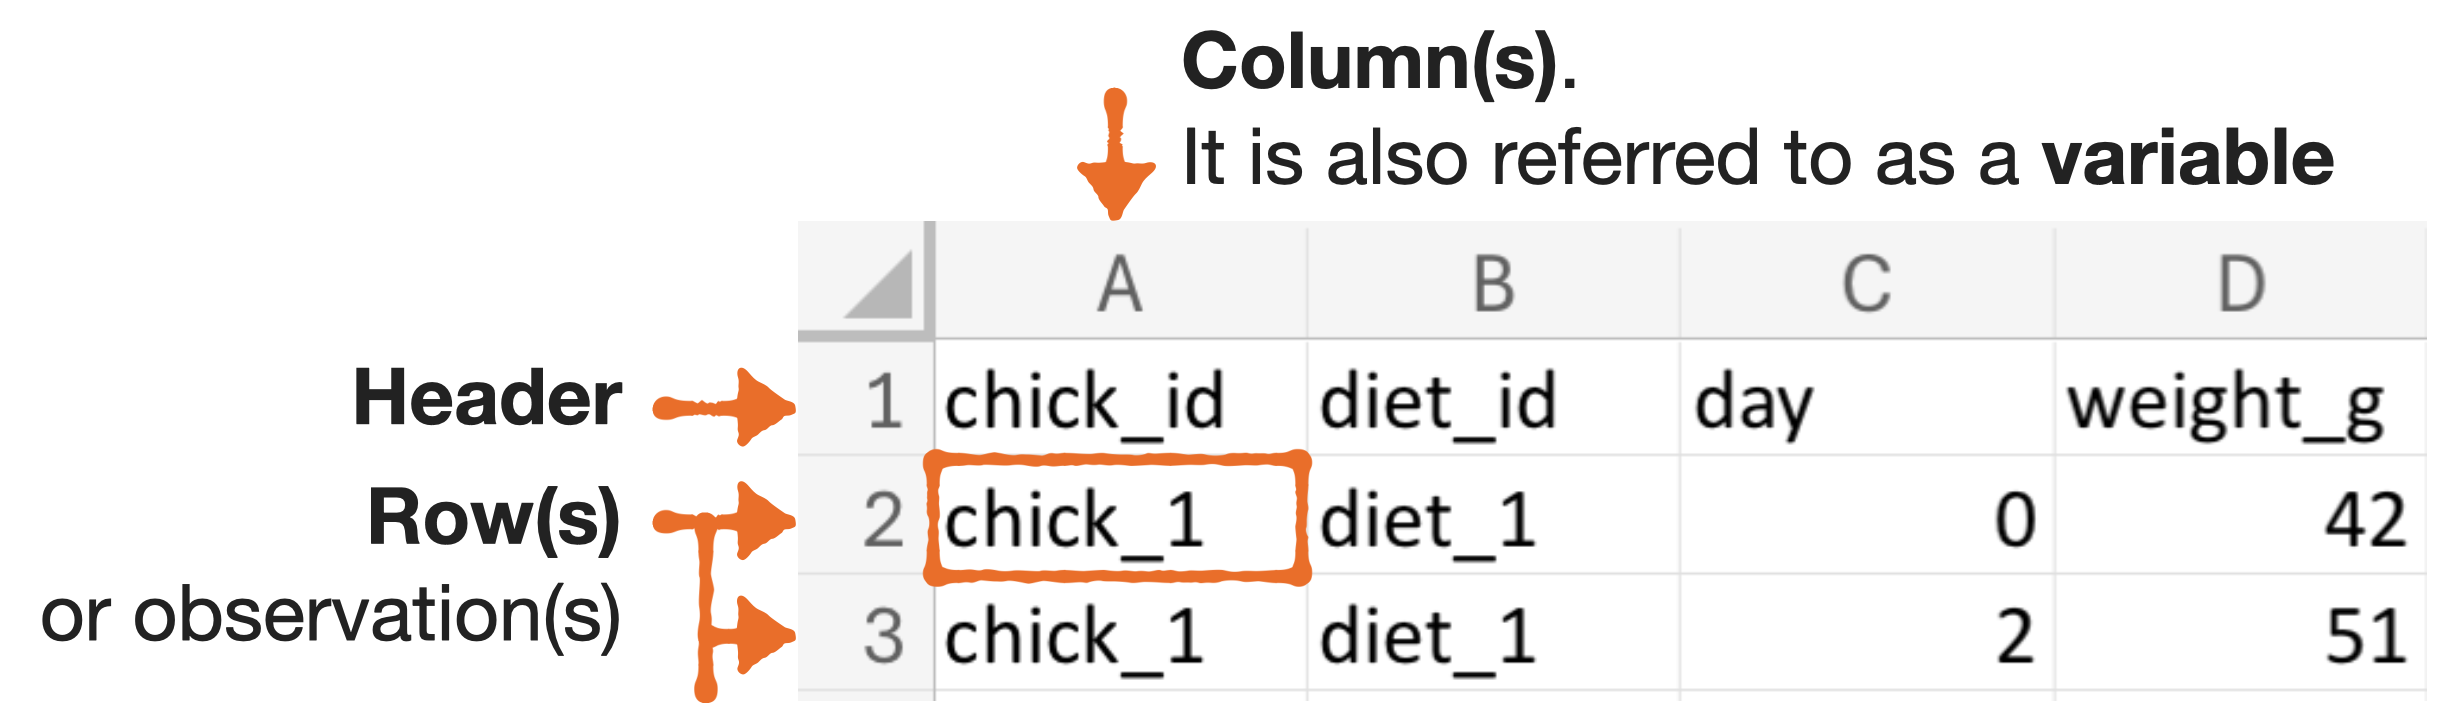
When you open the dataset, you will see the following table in Excel.
C. Descriptive Statistics
The aim of descriptive statistics is to summarize categorical and numerical data in an informative way, both numerically and graphically. Examples include mean, median, minimum, maximum, and standard deviation.
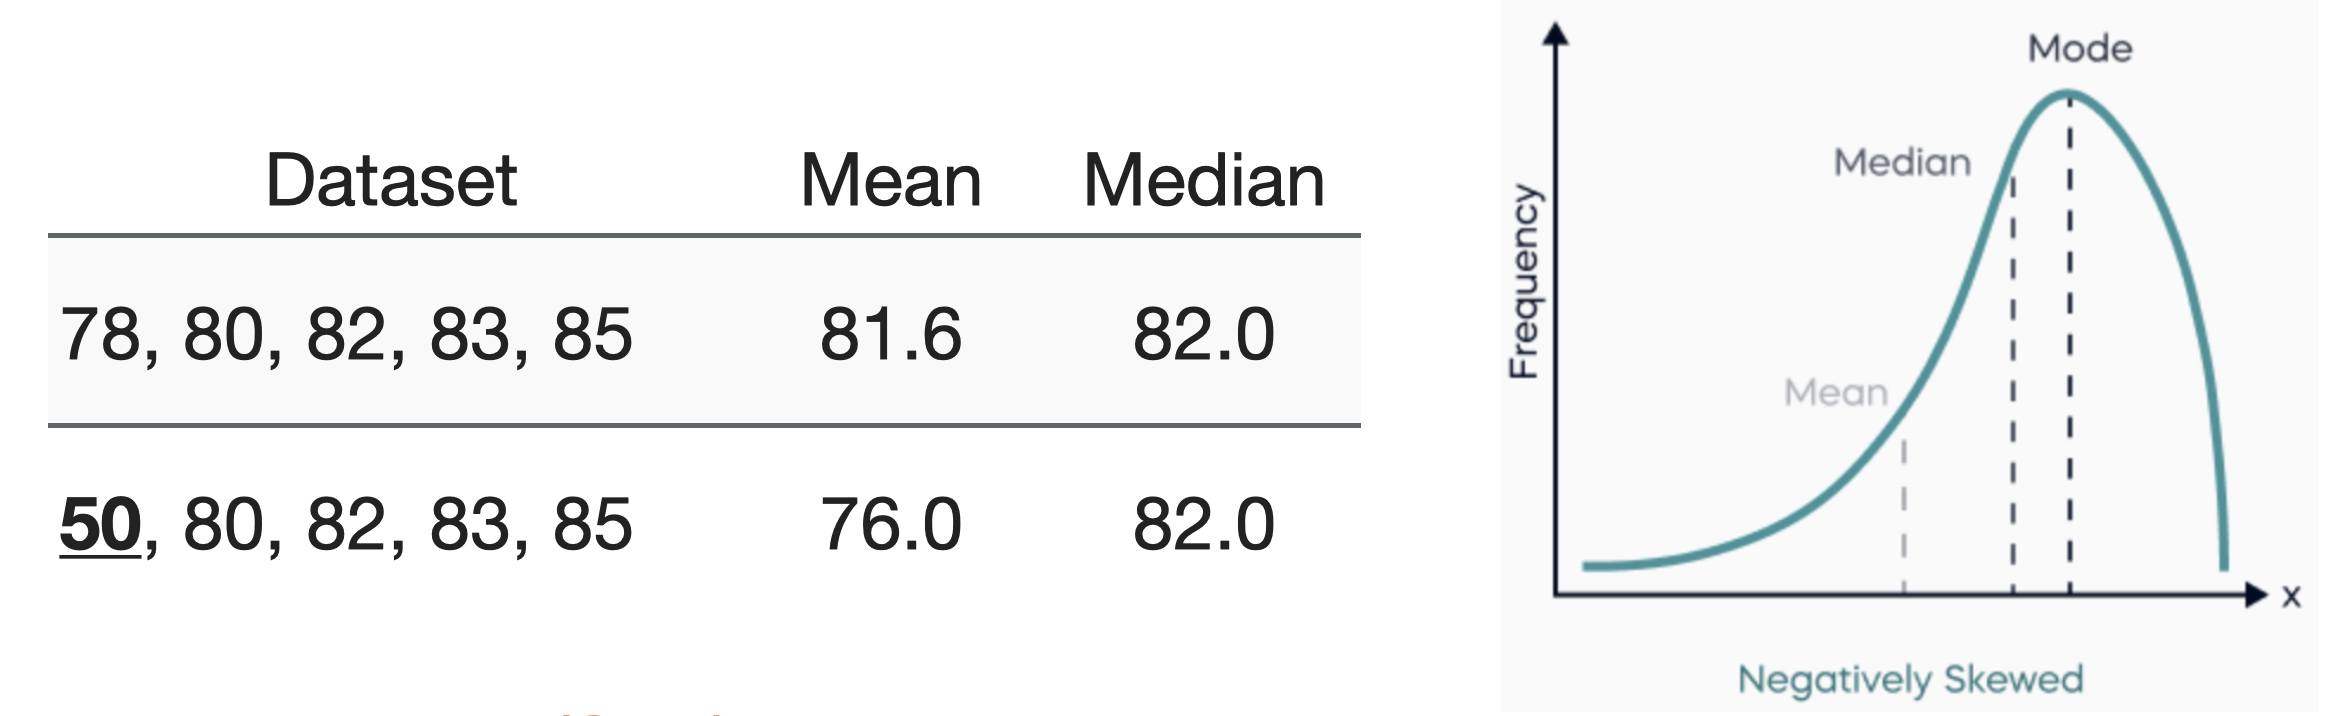
Mean vs. Median
-
Mean (μ): It represents the average value.
-
Median: It represents the middle value. More representative when outliers existed (skewed distributions).
Standard Deviation (std.)
- Standard Deviation (σ): How spread out the values are relative to their mean.

It is common to use mean ± std. to describe the distribution of a variable
D. Excel Basics
Excel cell address: {column}{row}
For example, A2 refers to the cell located in the first column and the second row.
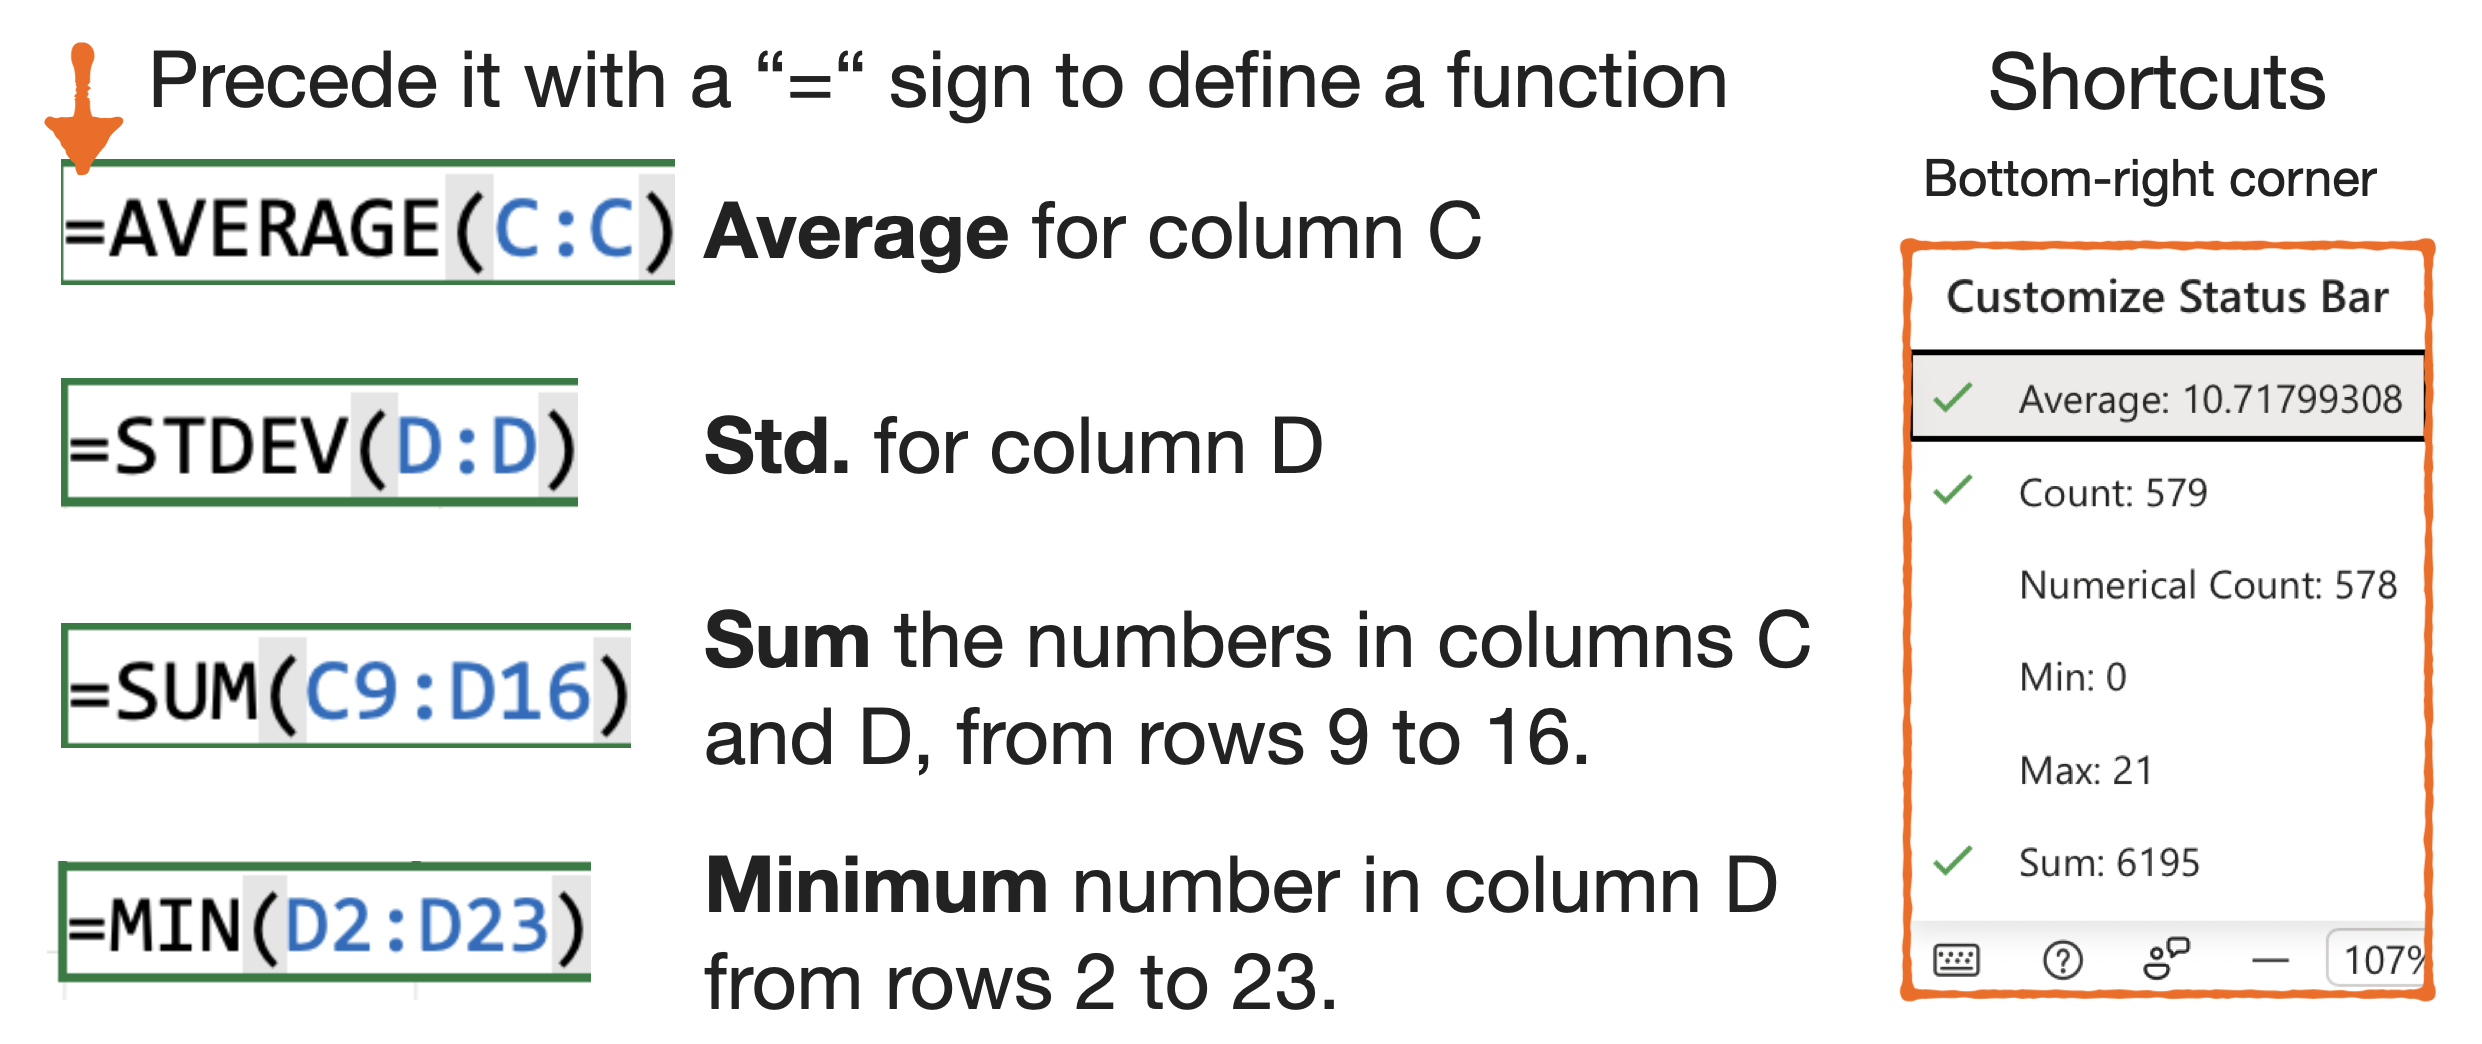
Calculating descriptive statistics
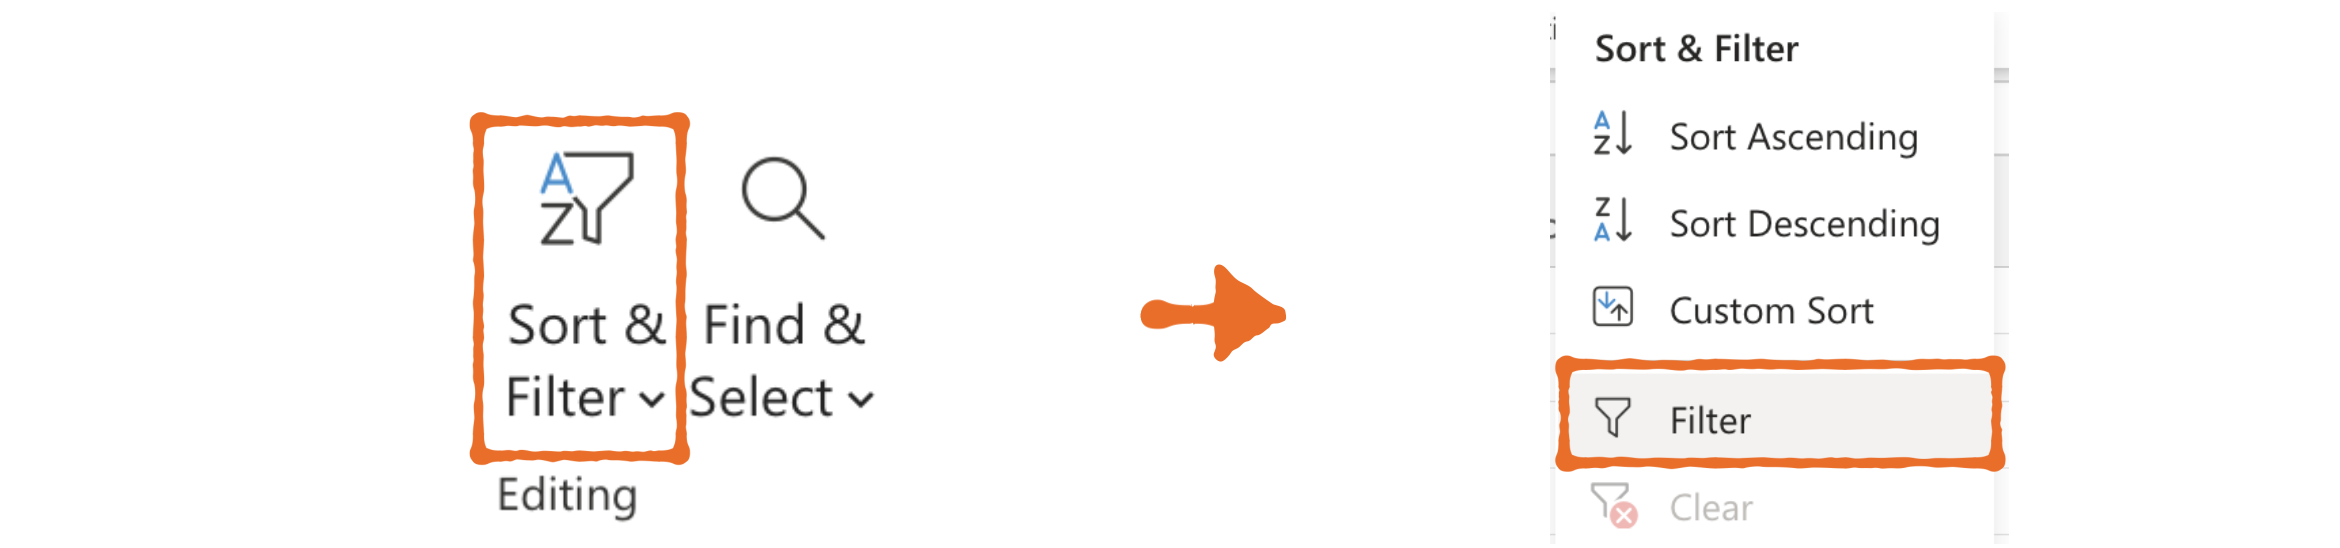
Filtering data