Multifaceted Visualization
A. Multifaceted Plot
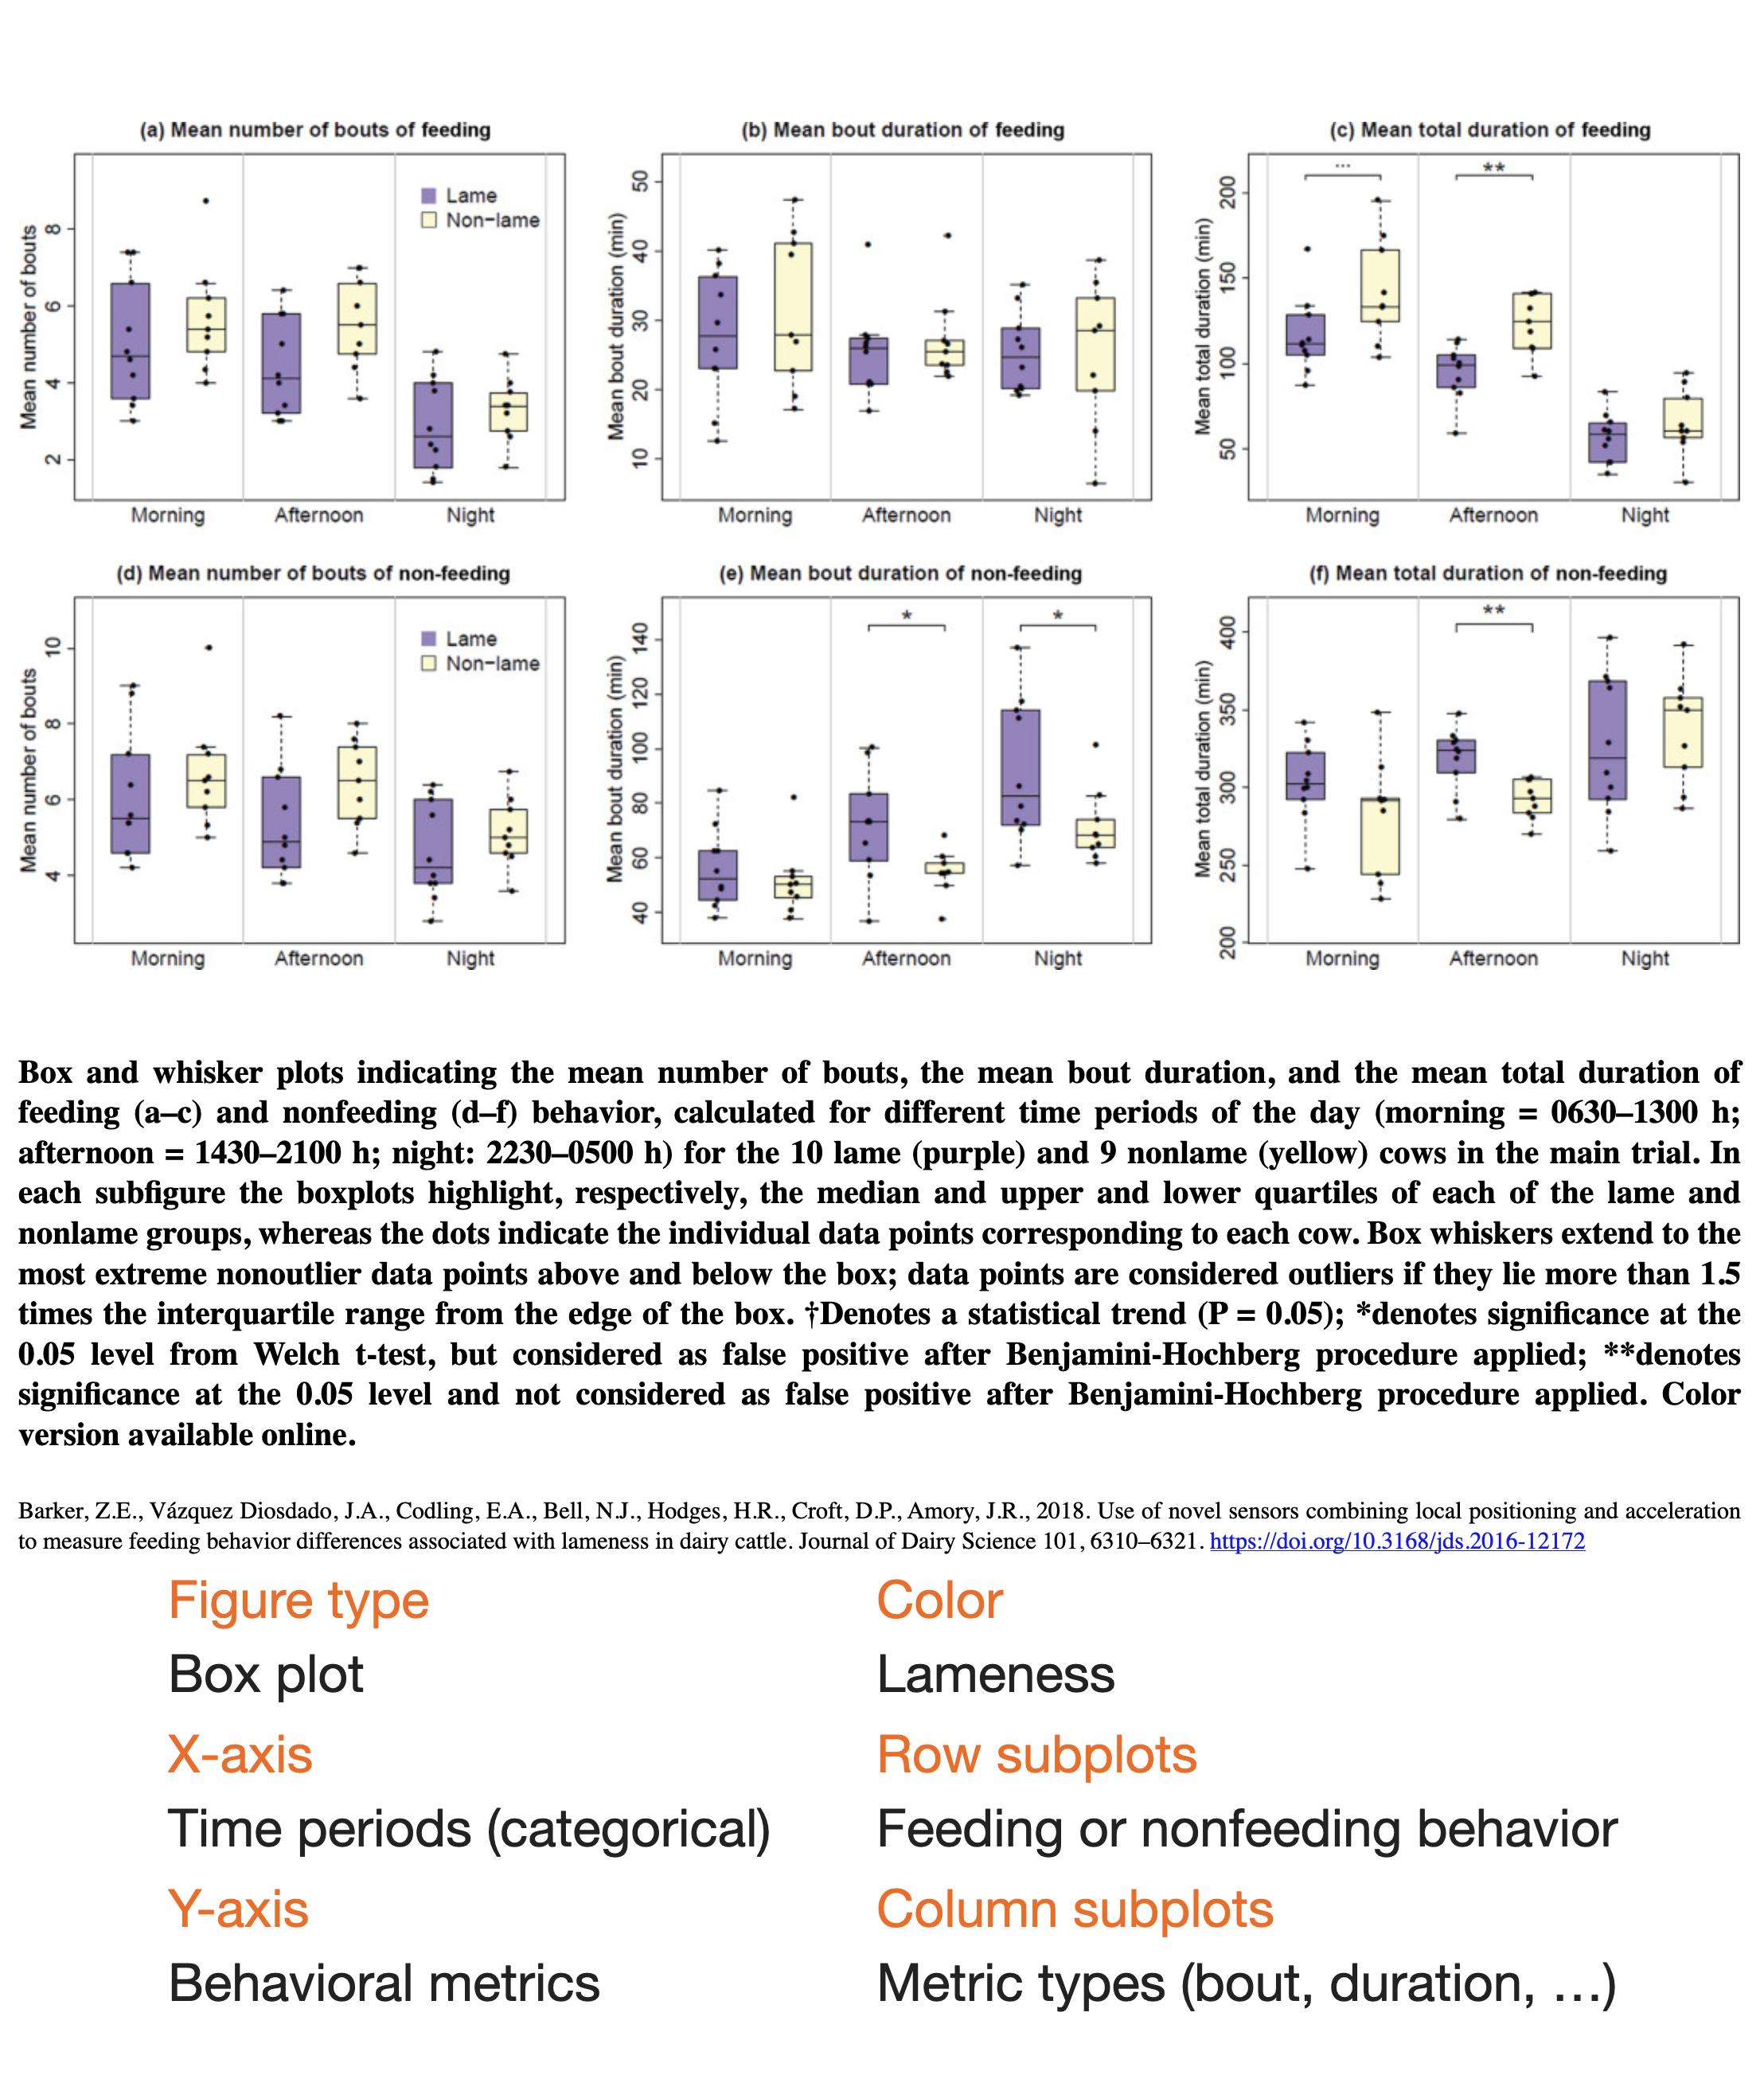
When you need to show more than two kinds of information in a single figure (beyond just the X- and Y-axes), you have two main options:
-
Use visual elements (within the same plot):
- Color (different groups shown in different colors)
- Marker or line style (different shapes or line patterns)
- Marker size (larger or smaller points to represent another variable)
-
Use faceting (multiple smaller plots):
- Rows of subplots
- Columns of subplots
B. Spend Your Chip Mindfully
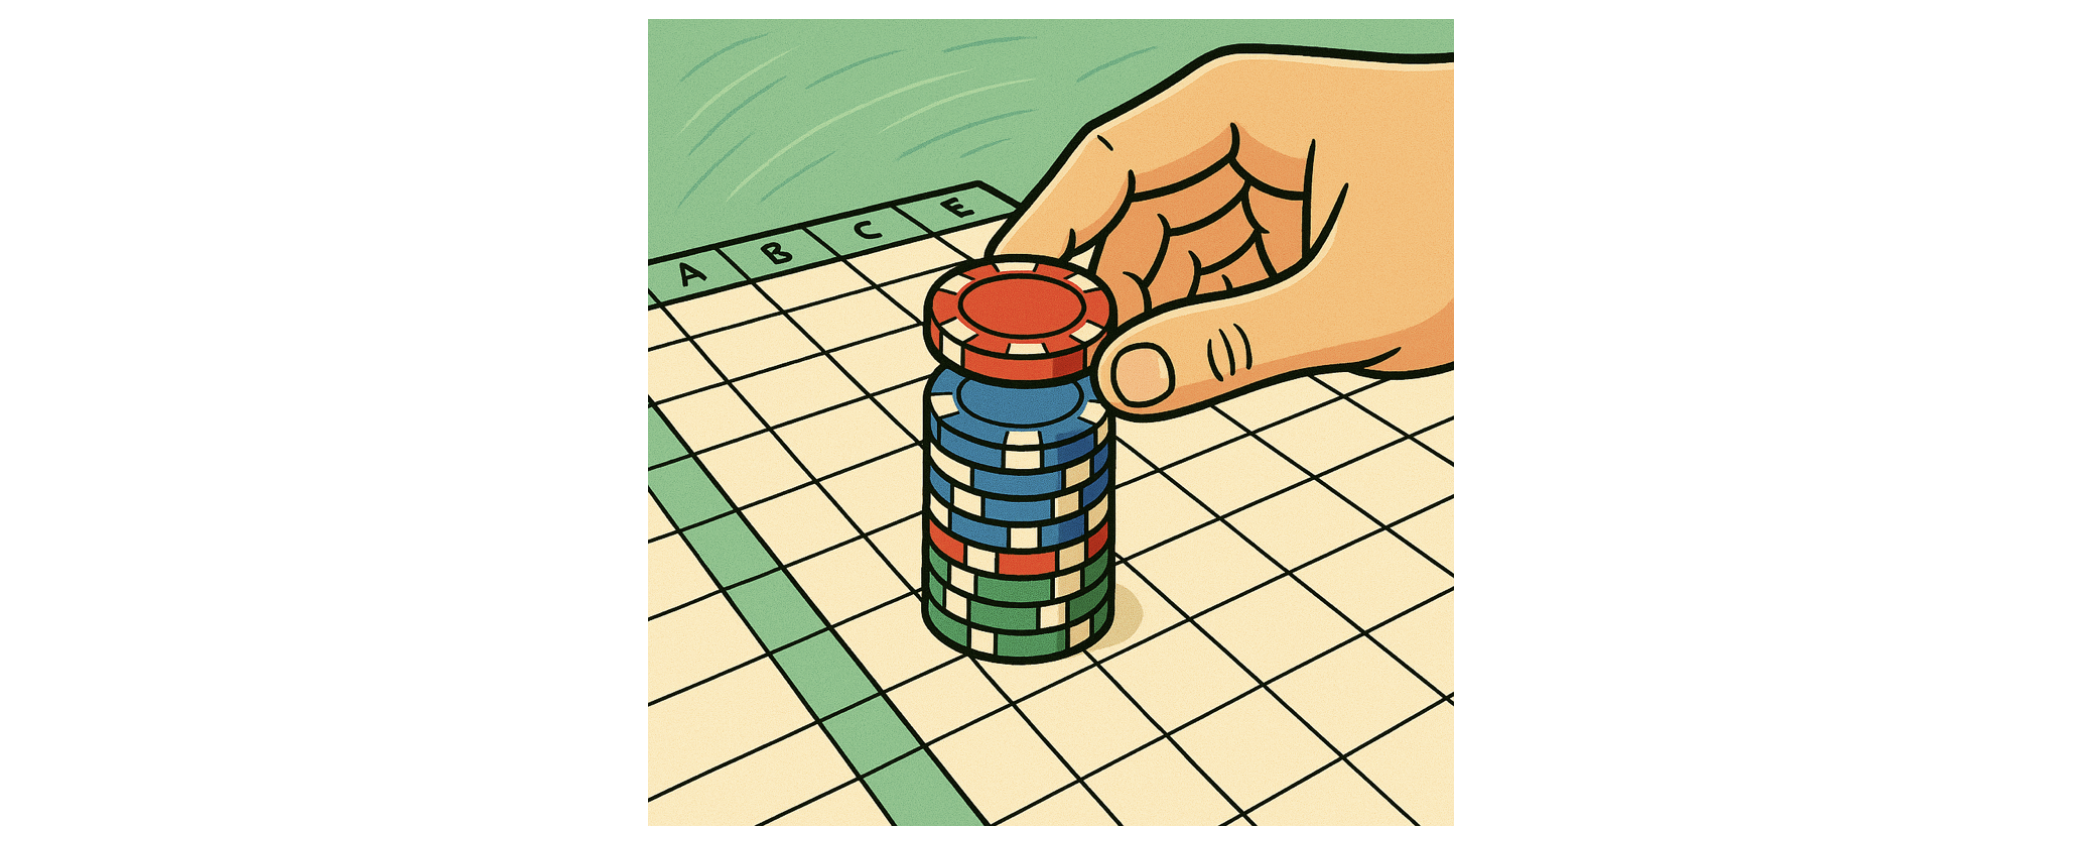
Remember “the casino chip metaphor”? Think of each visual element (color, shape, size, line style) or each facet (row, column) as a casino chip you spend to show another variable.
-
Spend them wisely: focus on the variables that best address your hypothesis.
-
Avoid using too many chips (variable) in the same figure. You only have a limited number of chips before the figure becomes cluttered and confusing.
C. Identify the Variable Placements
Example 1
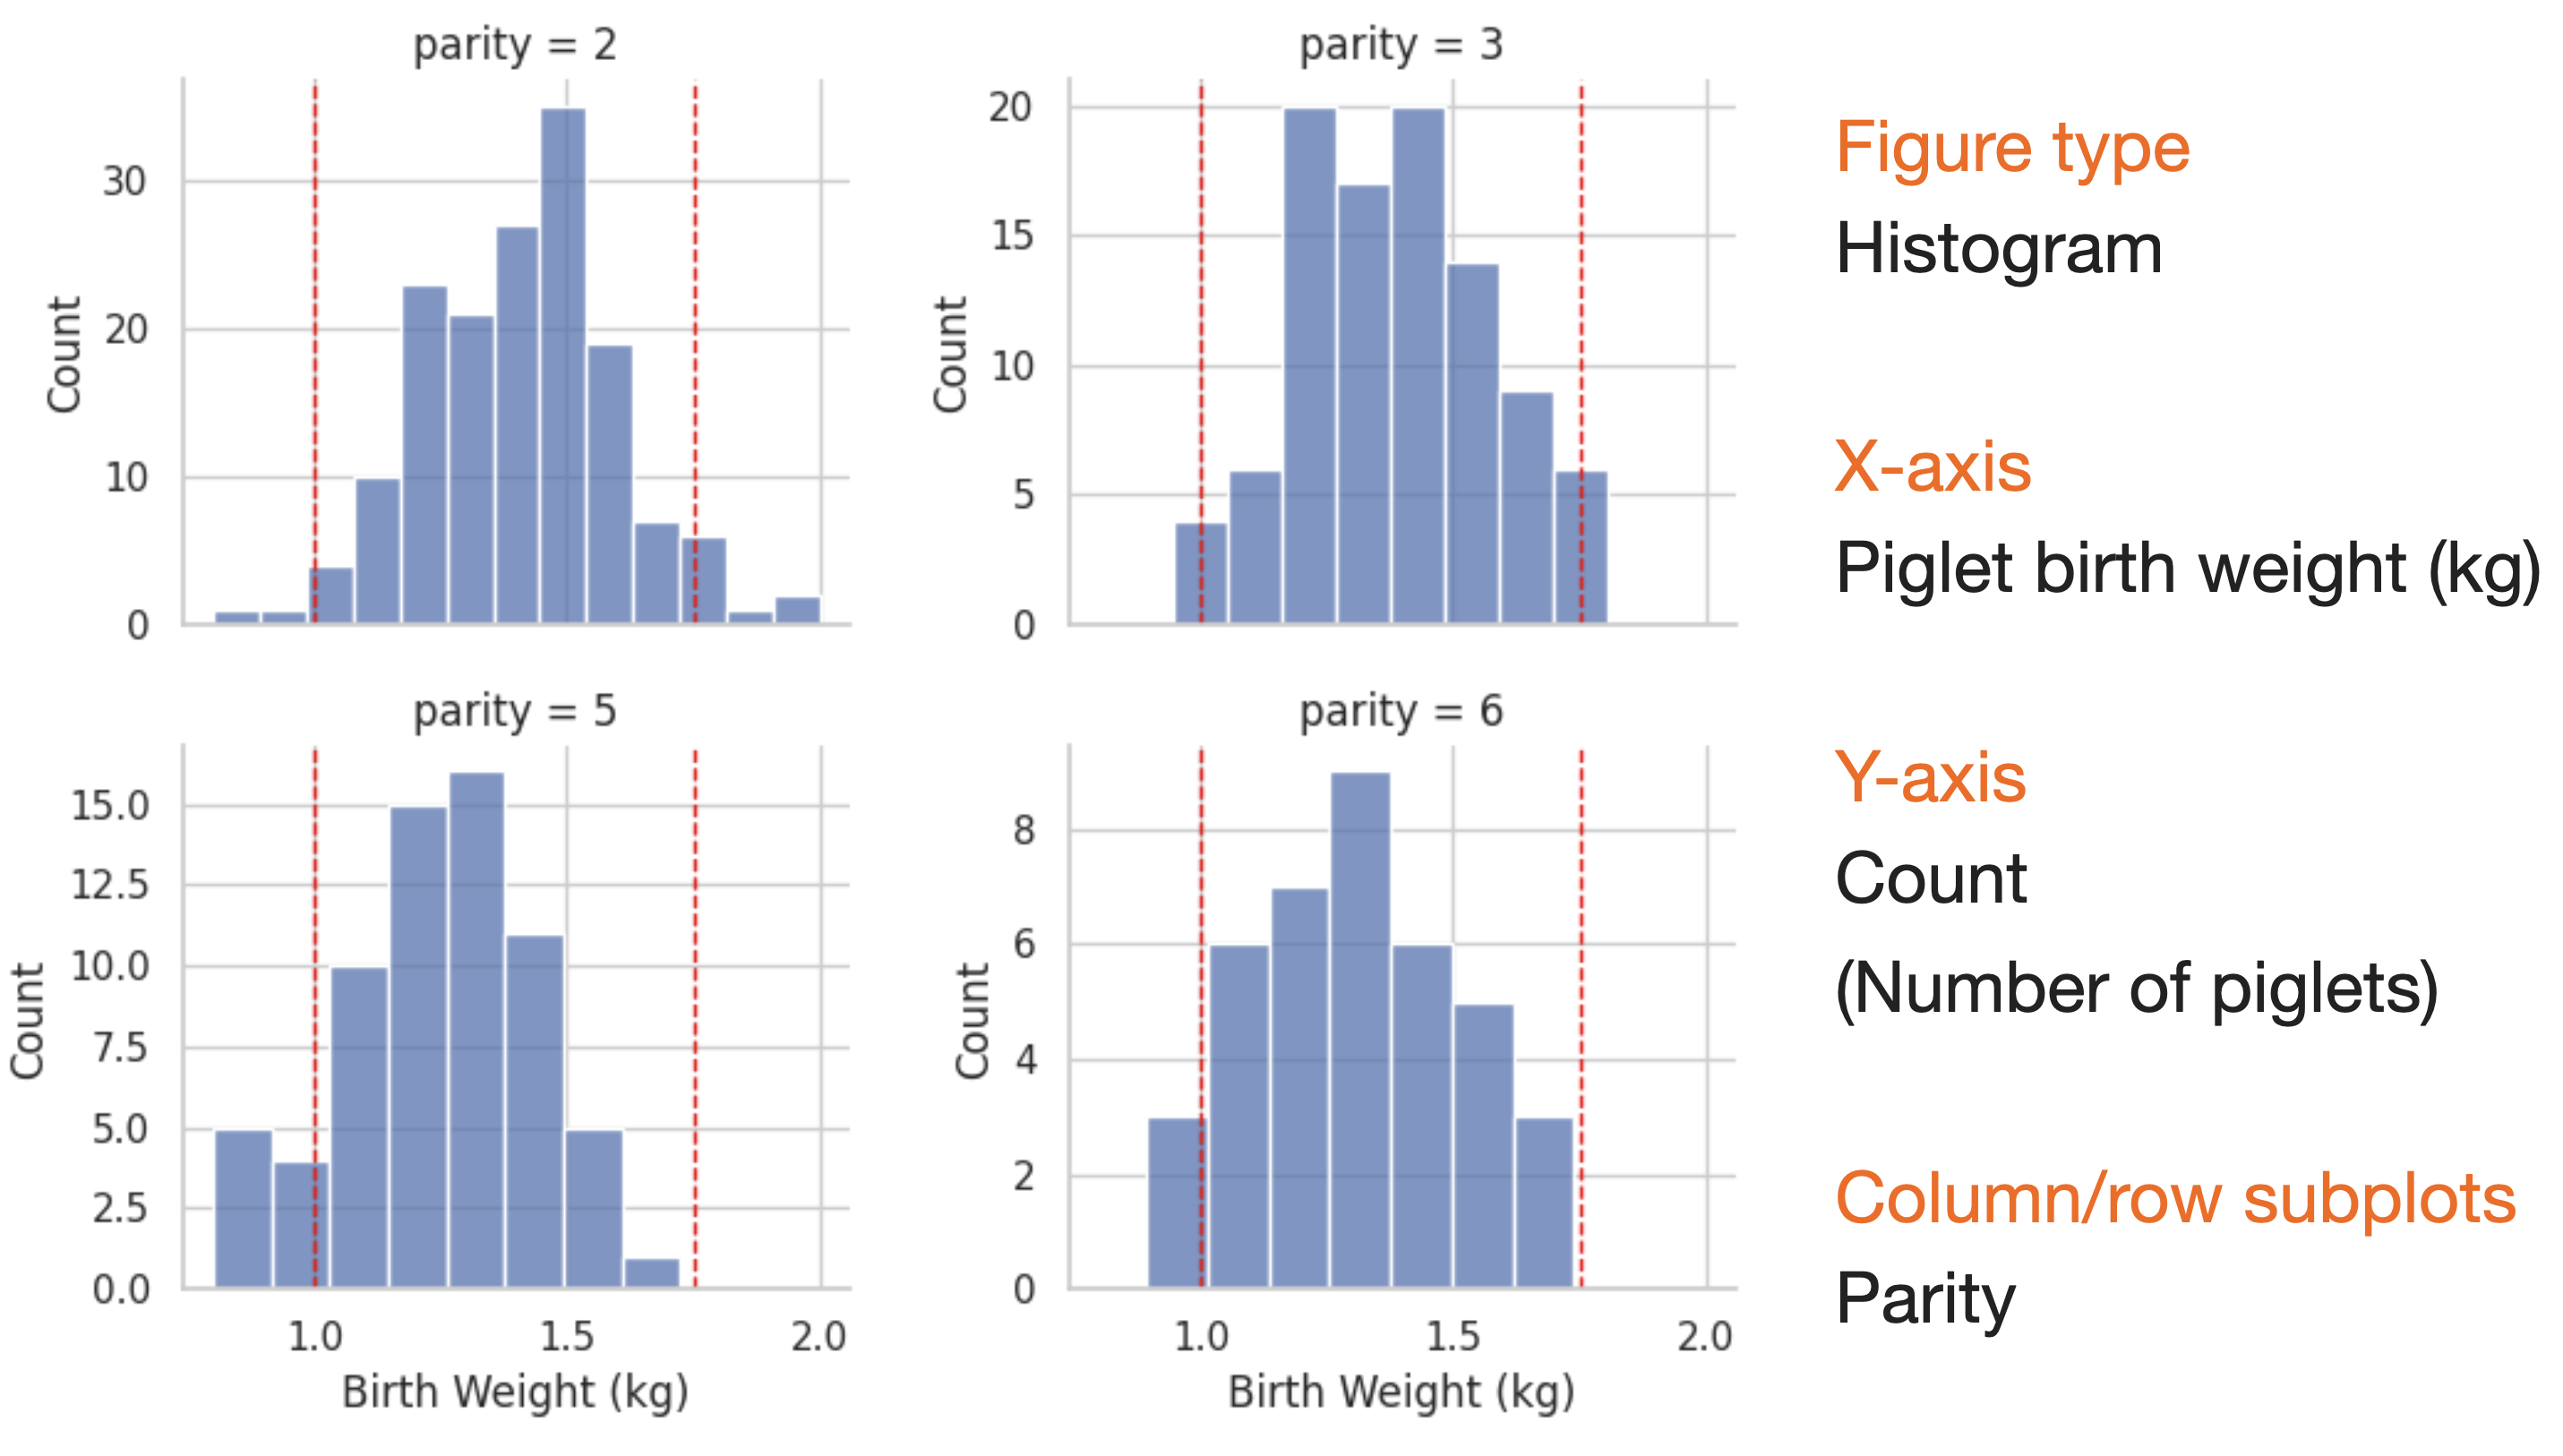
Possible Hypothesis?
Birth weight distribution is normal regardless of sow parity
Example 2
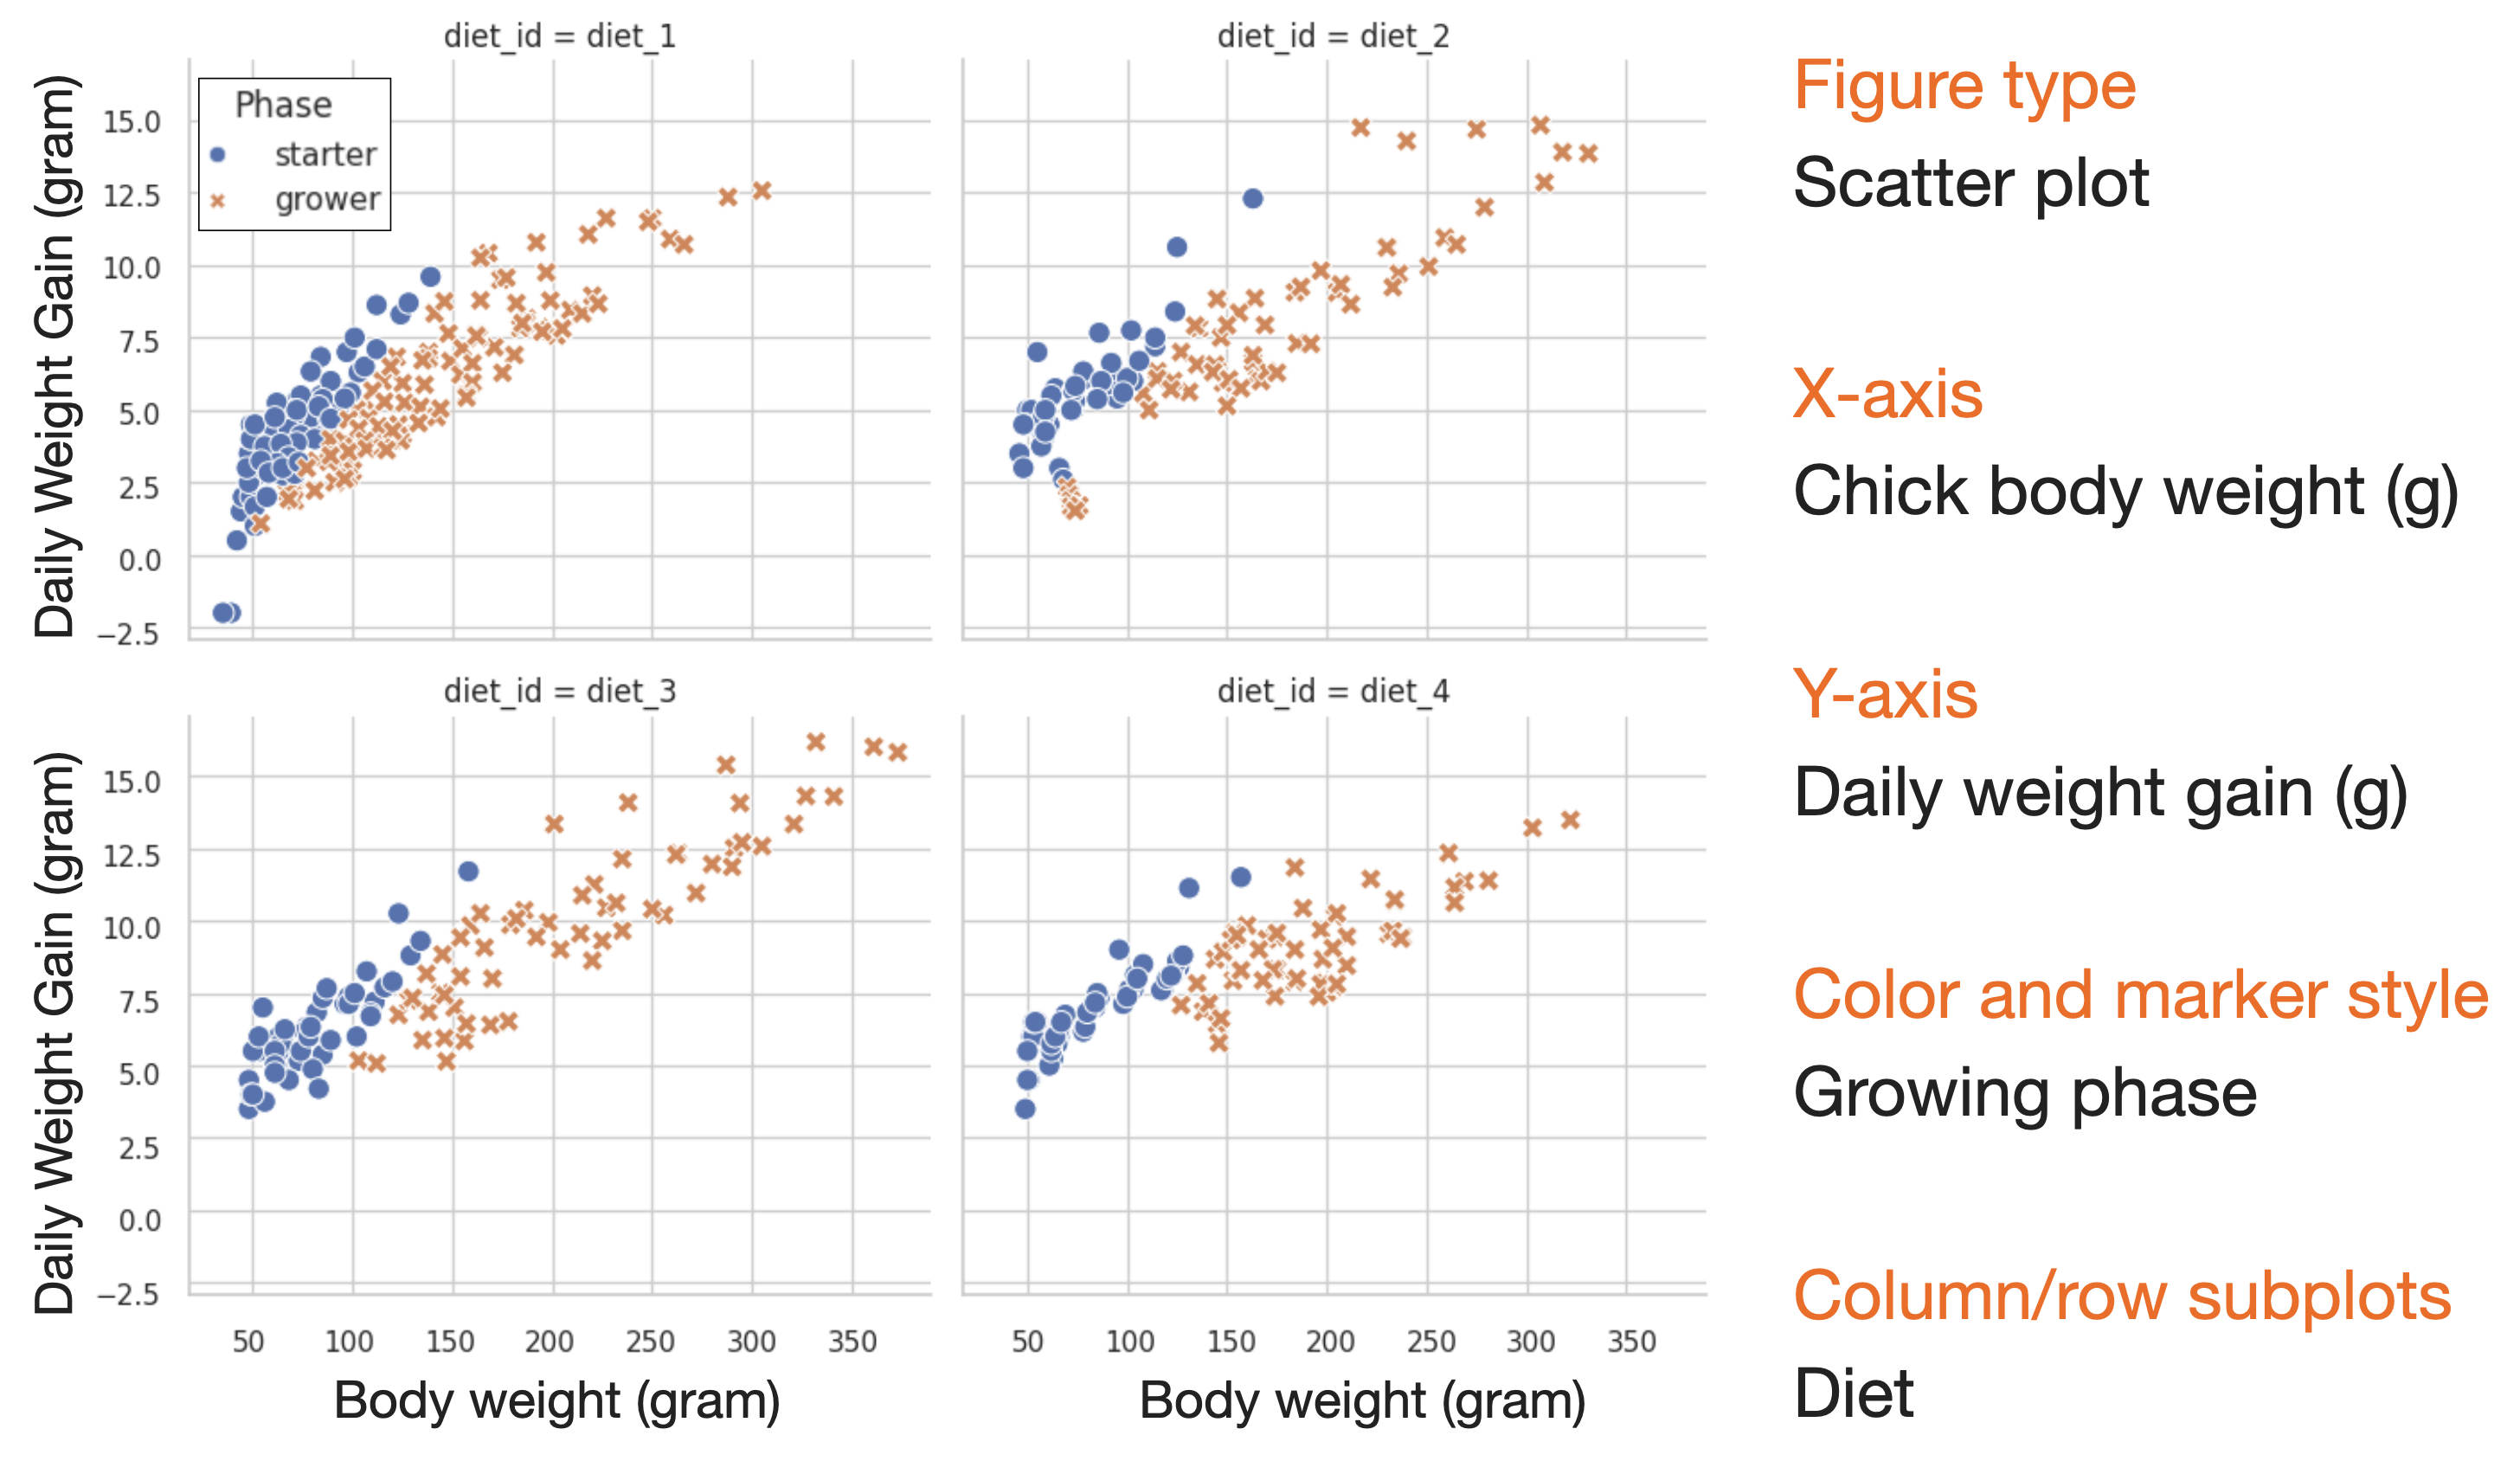
Possible Hypothesis?
Growth rate is independent of body weight and growing phase
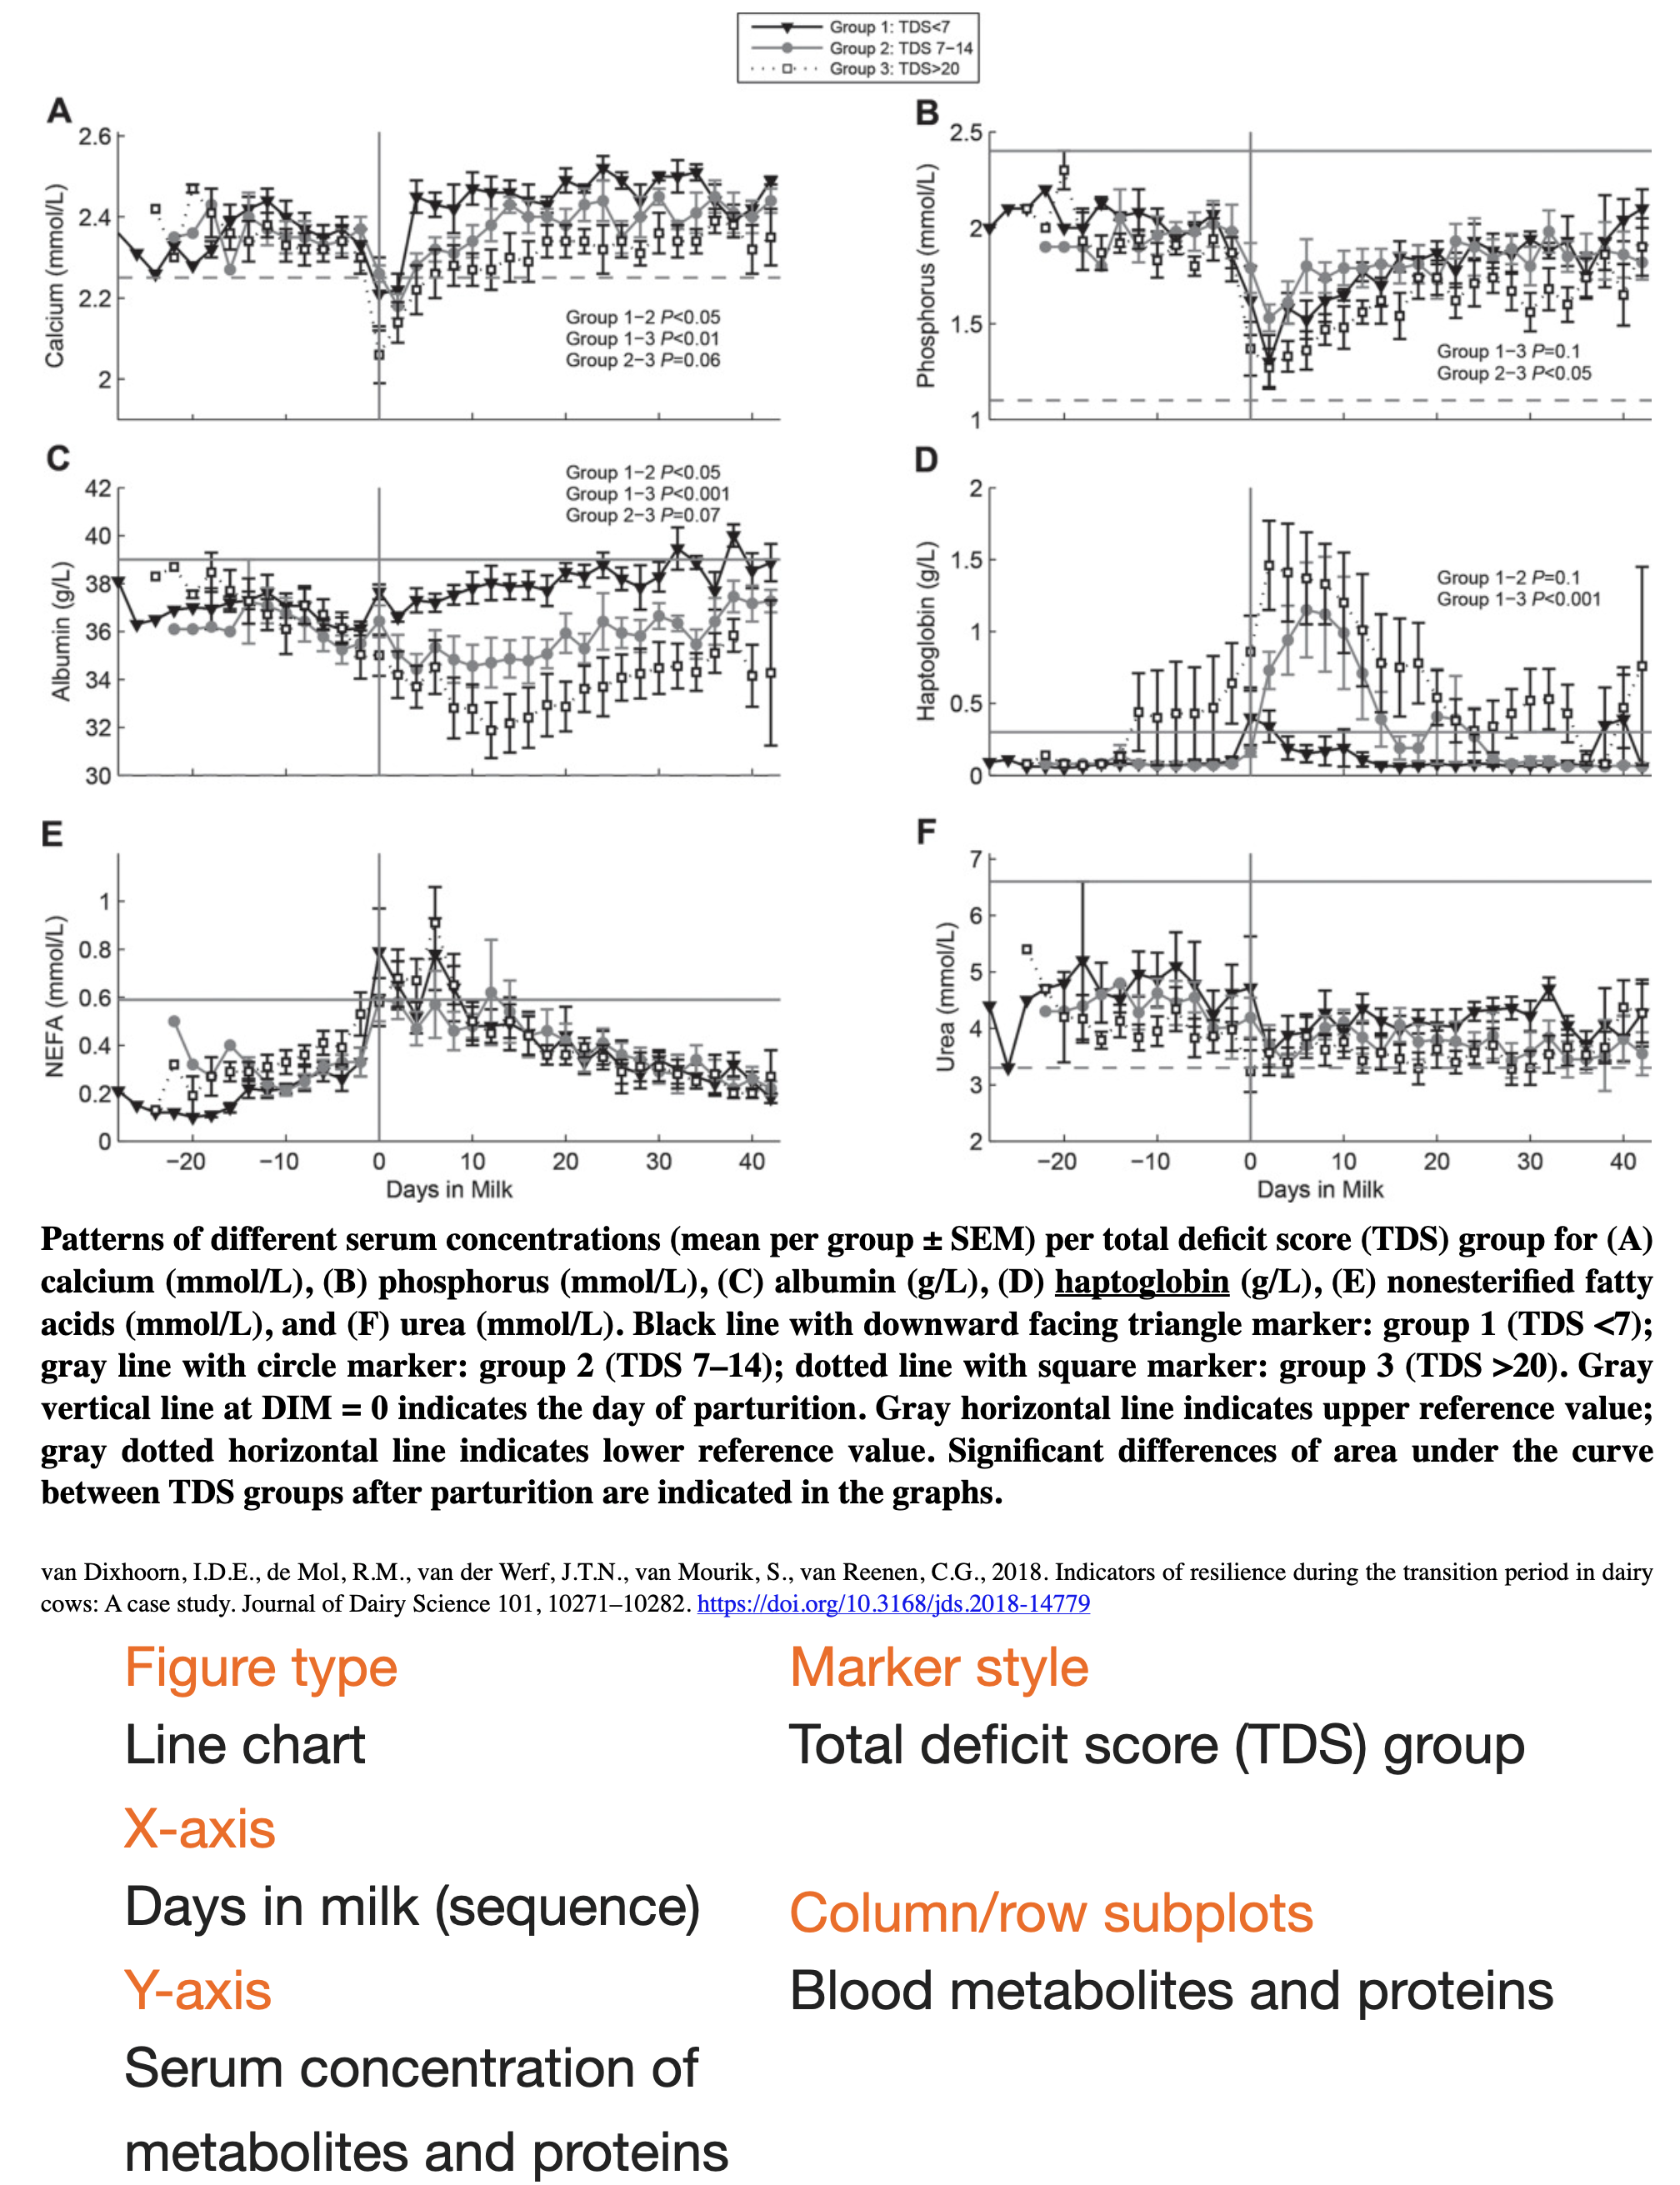
D. More Examples
Example 3
Example 4
E. Exercises
Can you identify the most suitable figure type and variable placement for the following hypotheses?
The growing phase (starter vs. grower) has no effect on the average daily weight gain across diets.
For both parity groups (primiparous and multiparous sows), there is no significant correlation between litter size and the average body weight of piglets.