Data Visualization
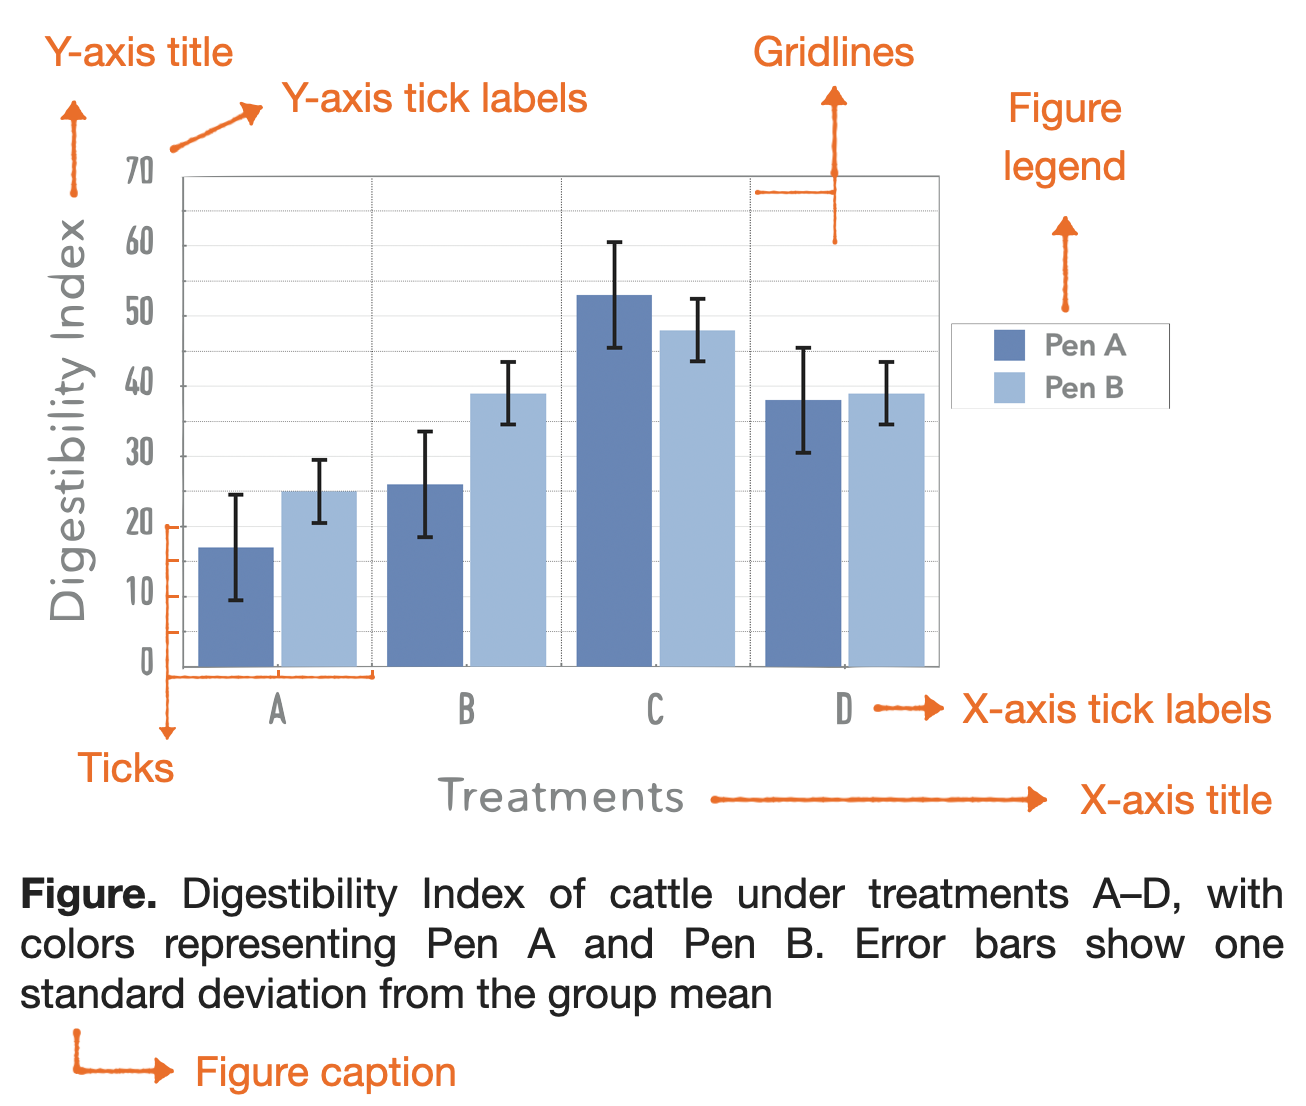
A. Essential Components of a Figure?
B. Key Concepts in Data Visualization
- Except for histograms, variables on the x-axis are typically independent variables that can be controlled or managed in an experiment (e.g., date, treatment, gender, and breed)
- Additional grouping variables are distinguished by color or marker shape (e.g., open circle vs. solid triangle).
- Variables on the y-axis are response variables that cannot be controlled but are measured or observed (e.g., body weight, life span, gene expression, disease recovery rate).
- Figure captions should be self-explanatory, and abbreviations may only be used if fully spelled out at their first occurrence within the same caption.
C. How to Choose the Right Type of Figure?
A flowchart approach:
When the x-axis is a categorical variable
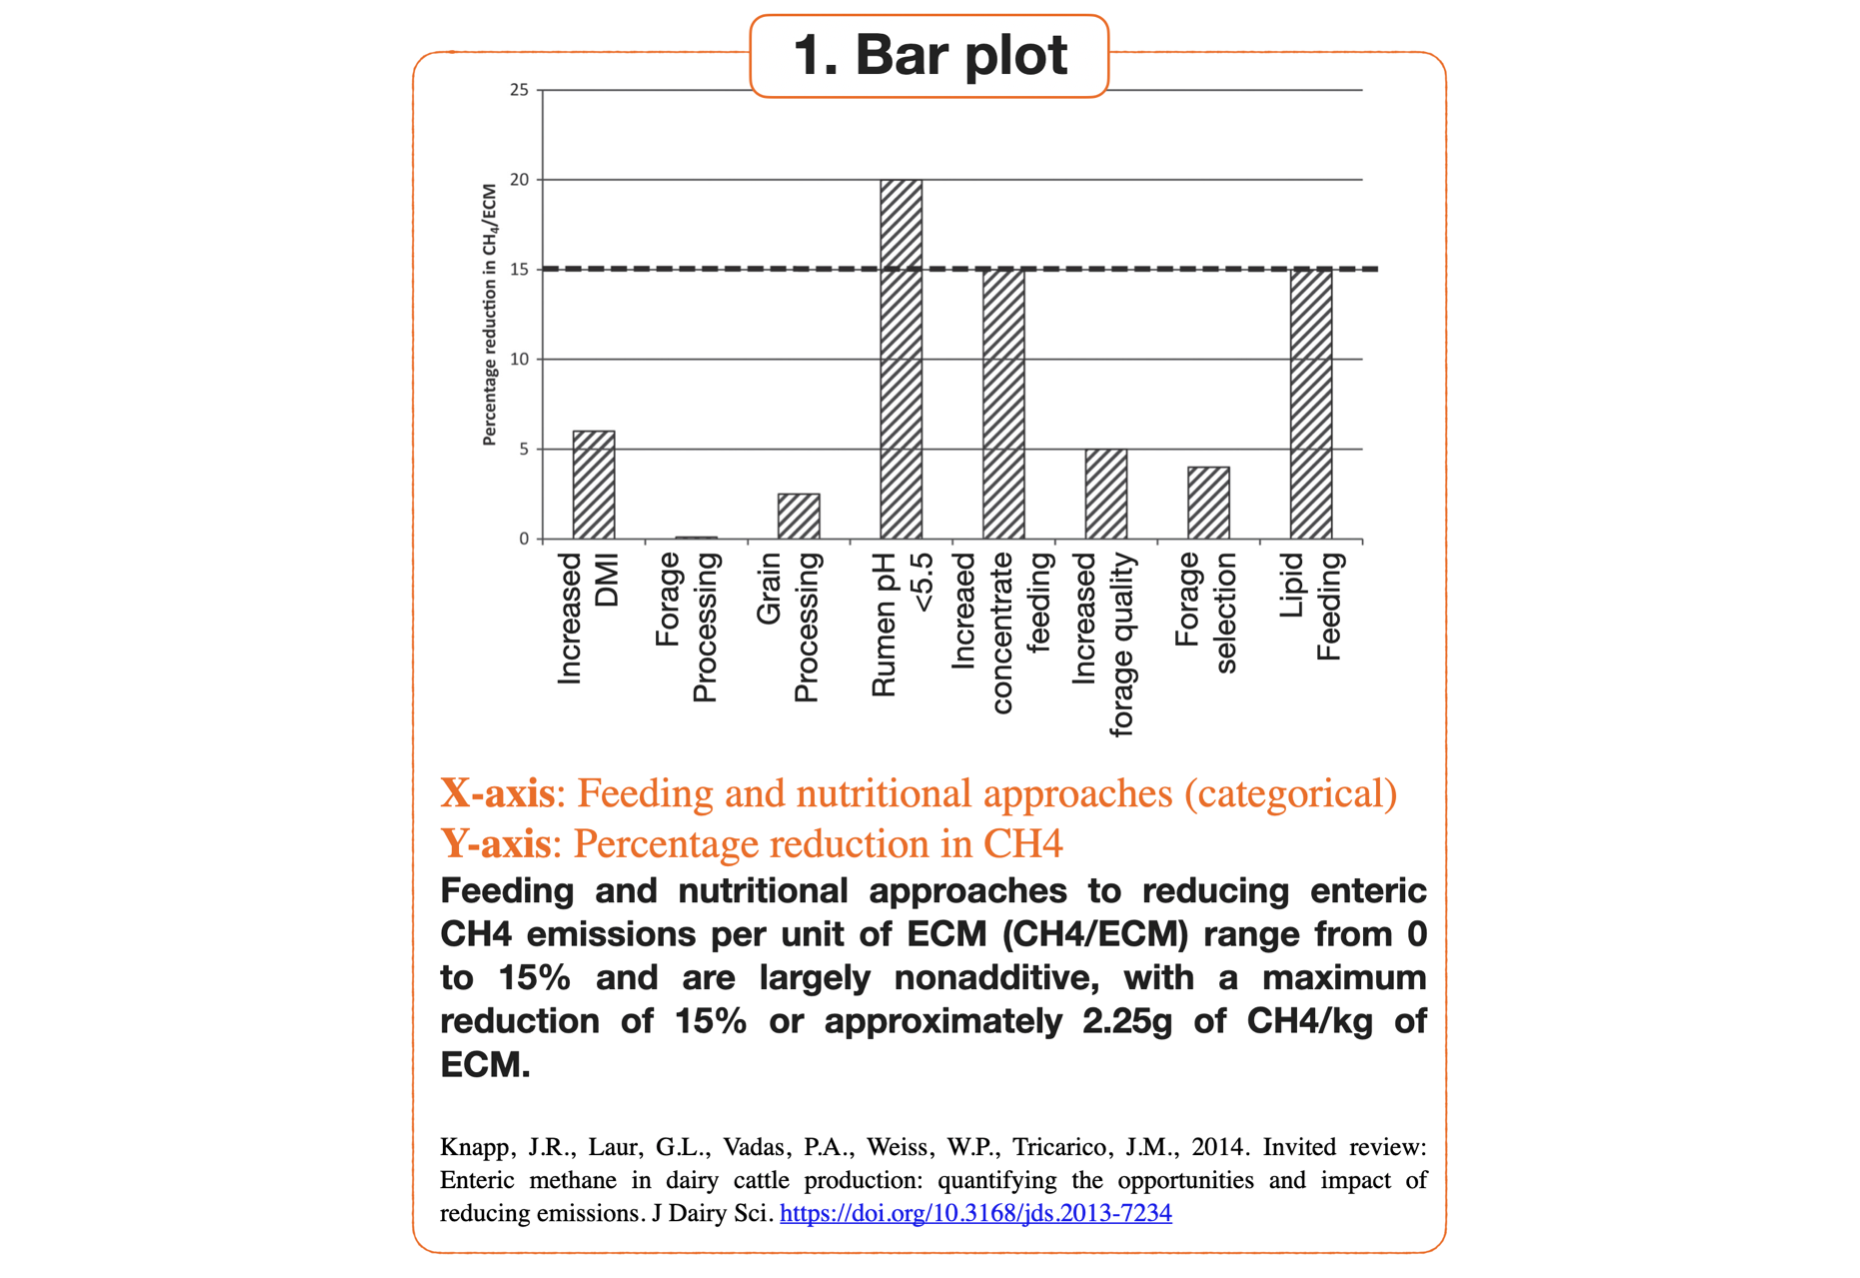
Variables such as treatment groups, breeds, or genotypes may not have a meaningful midpoint or order among their categories. For instance, treatment groups A, B, and C represent three distinct categories that cannot be ranked or have a midpoint established between them (for example, A.5 is not a meaningful midpoint between A and B).
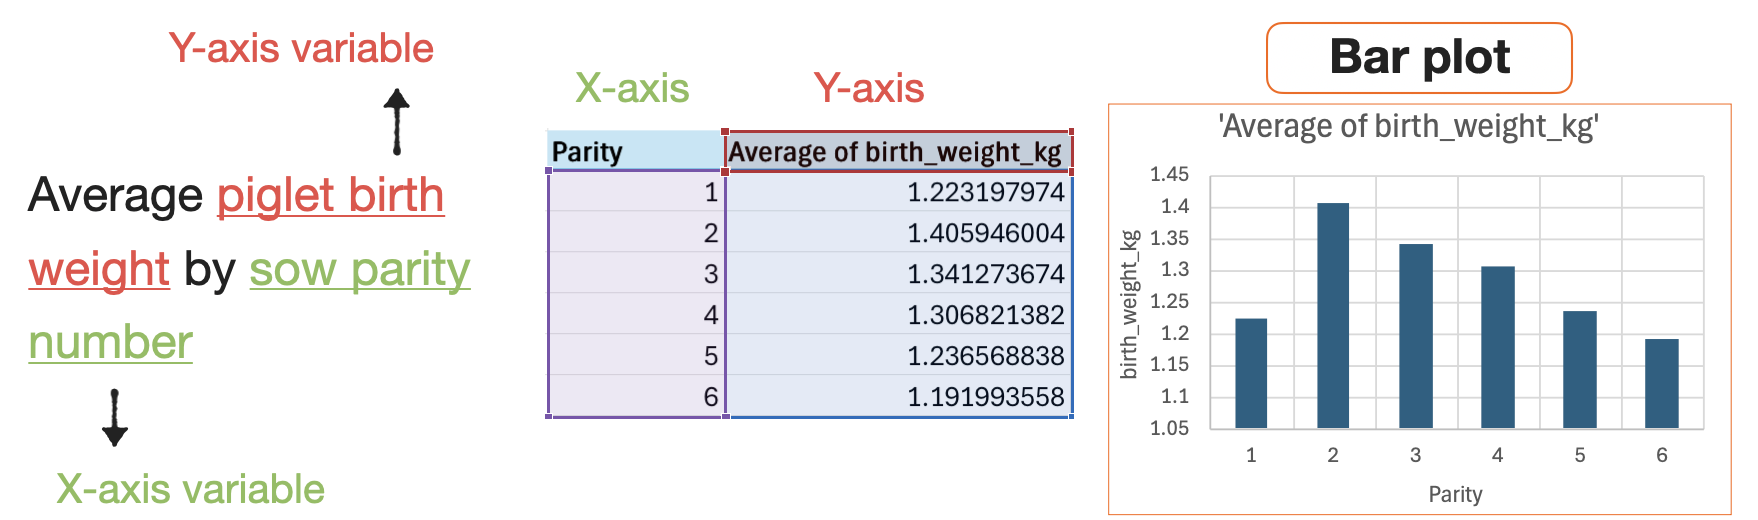
1. Bar Plot (Distribution is NOT of interest)
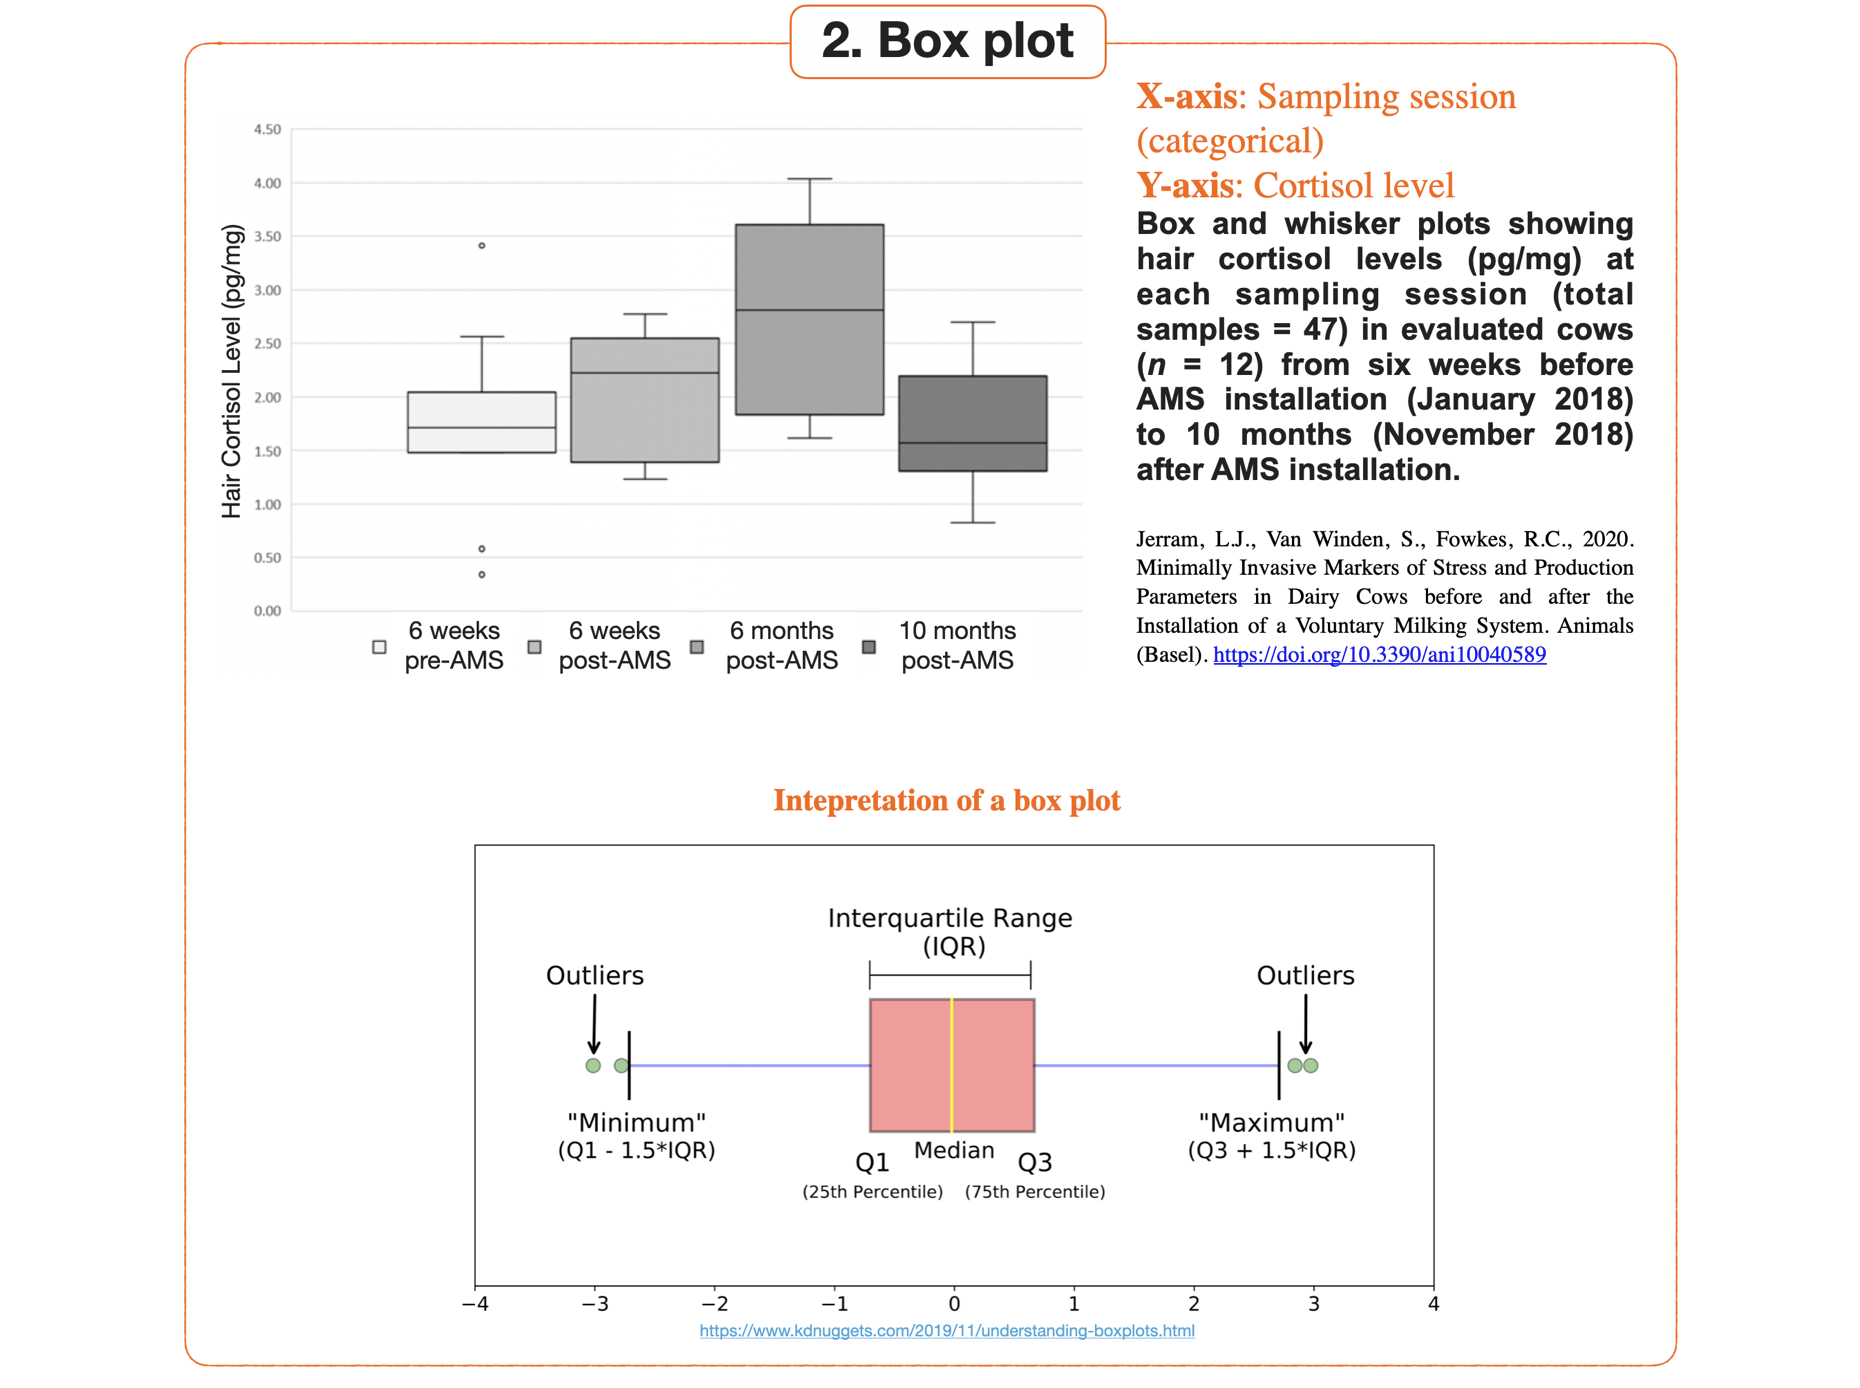
Next, we want to ask: are we interested in the distribution of the response variable within each category? If so, a box plot is a good choice. If not, a bar plot is a better choice.
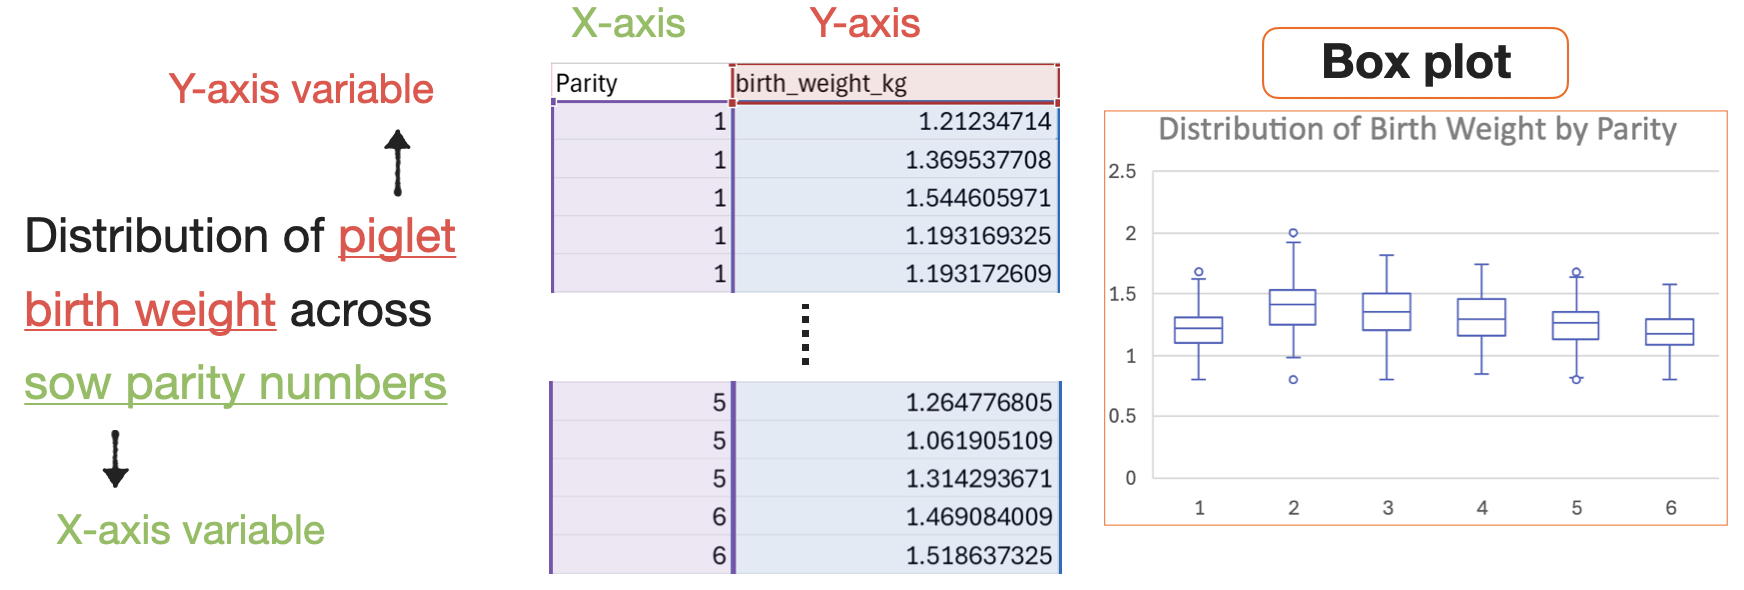
2. Box Plot (Distribution is of interest)
When the x-axis is a continuous variable
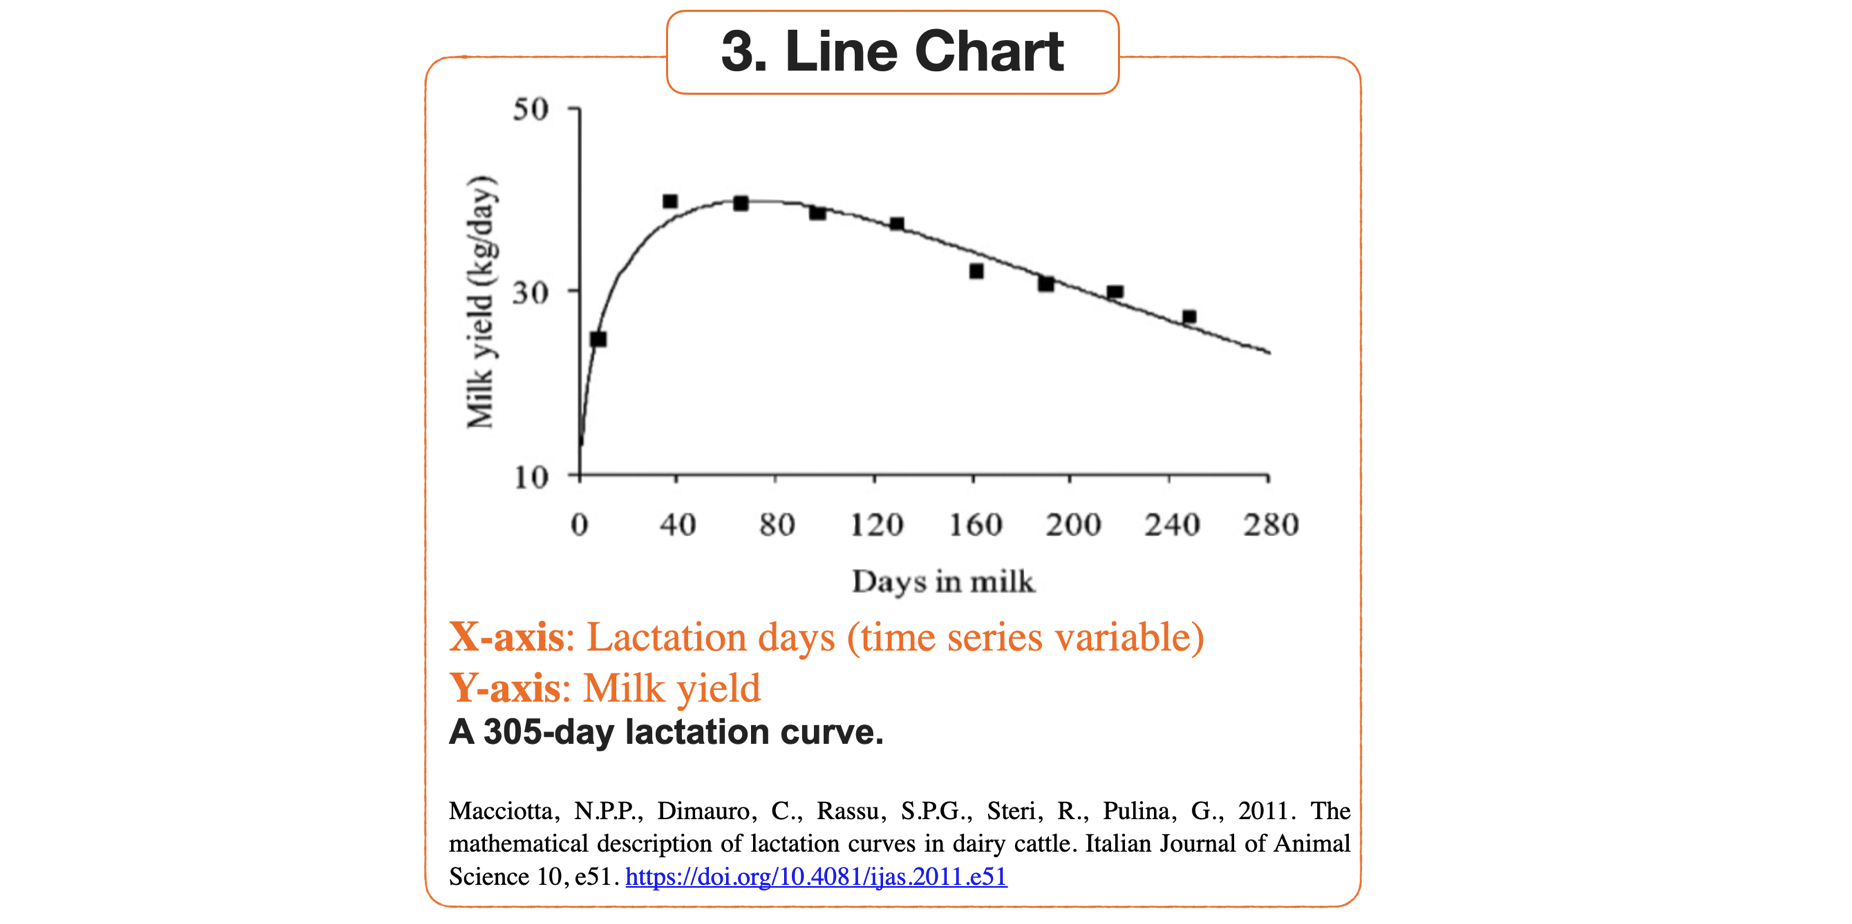
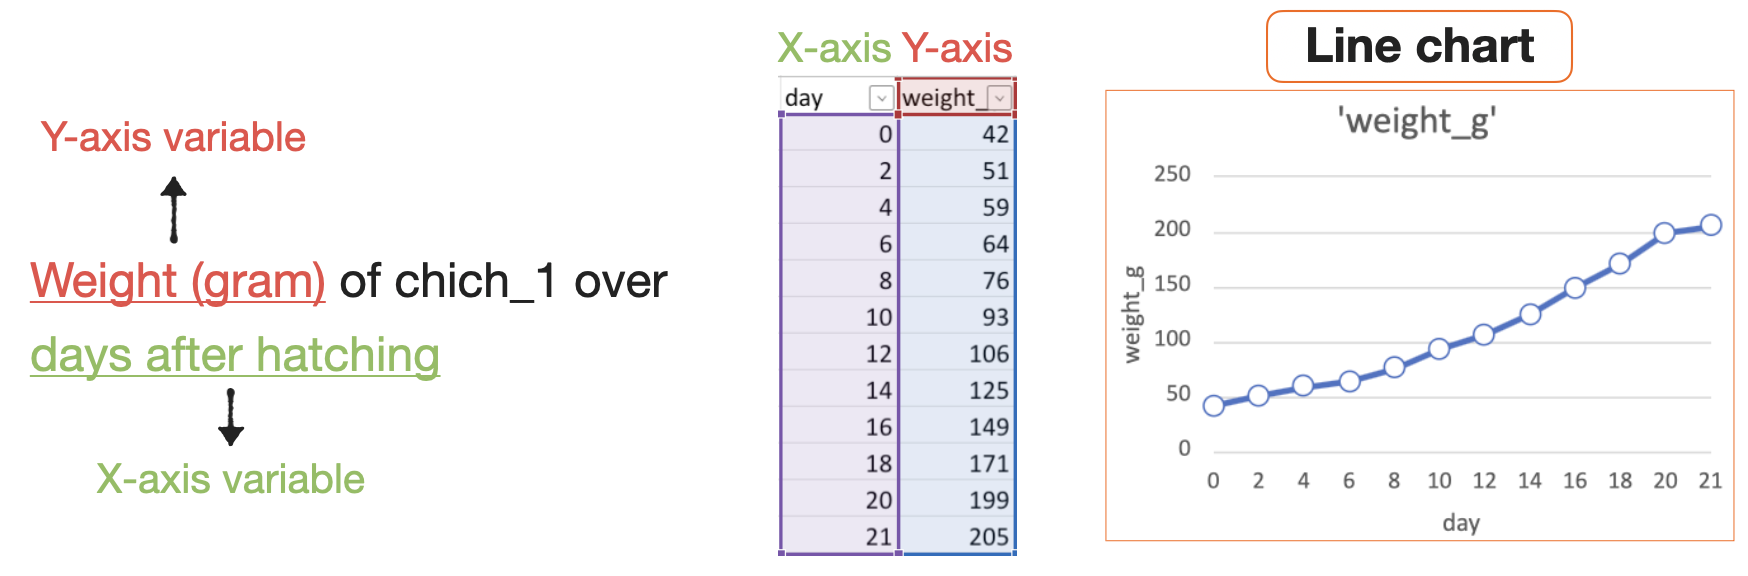
3. Line Chart (Sequential variable)
Such as time, age, or weight. Next, if the x-axis variable is a sequential variable (e.g., time), a line chart is a good choice.
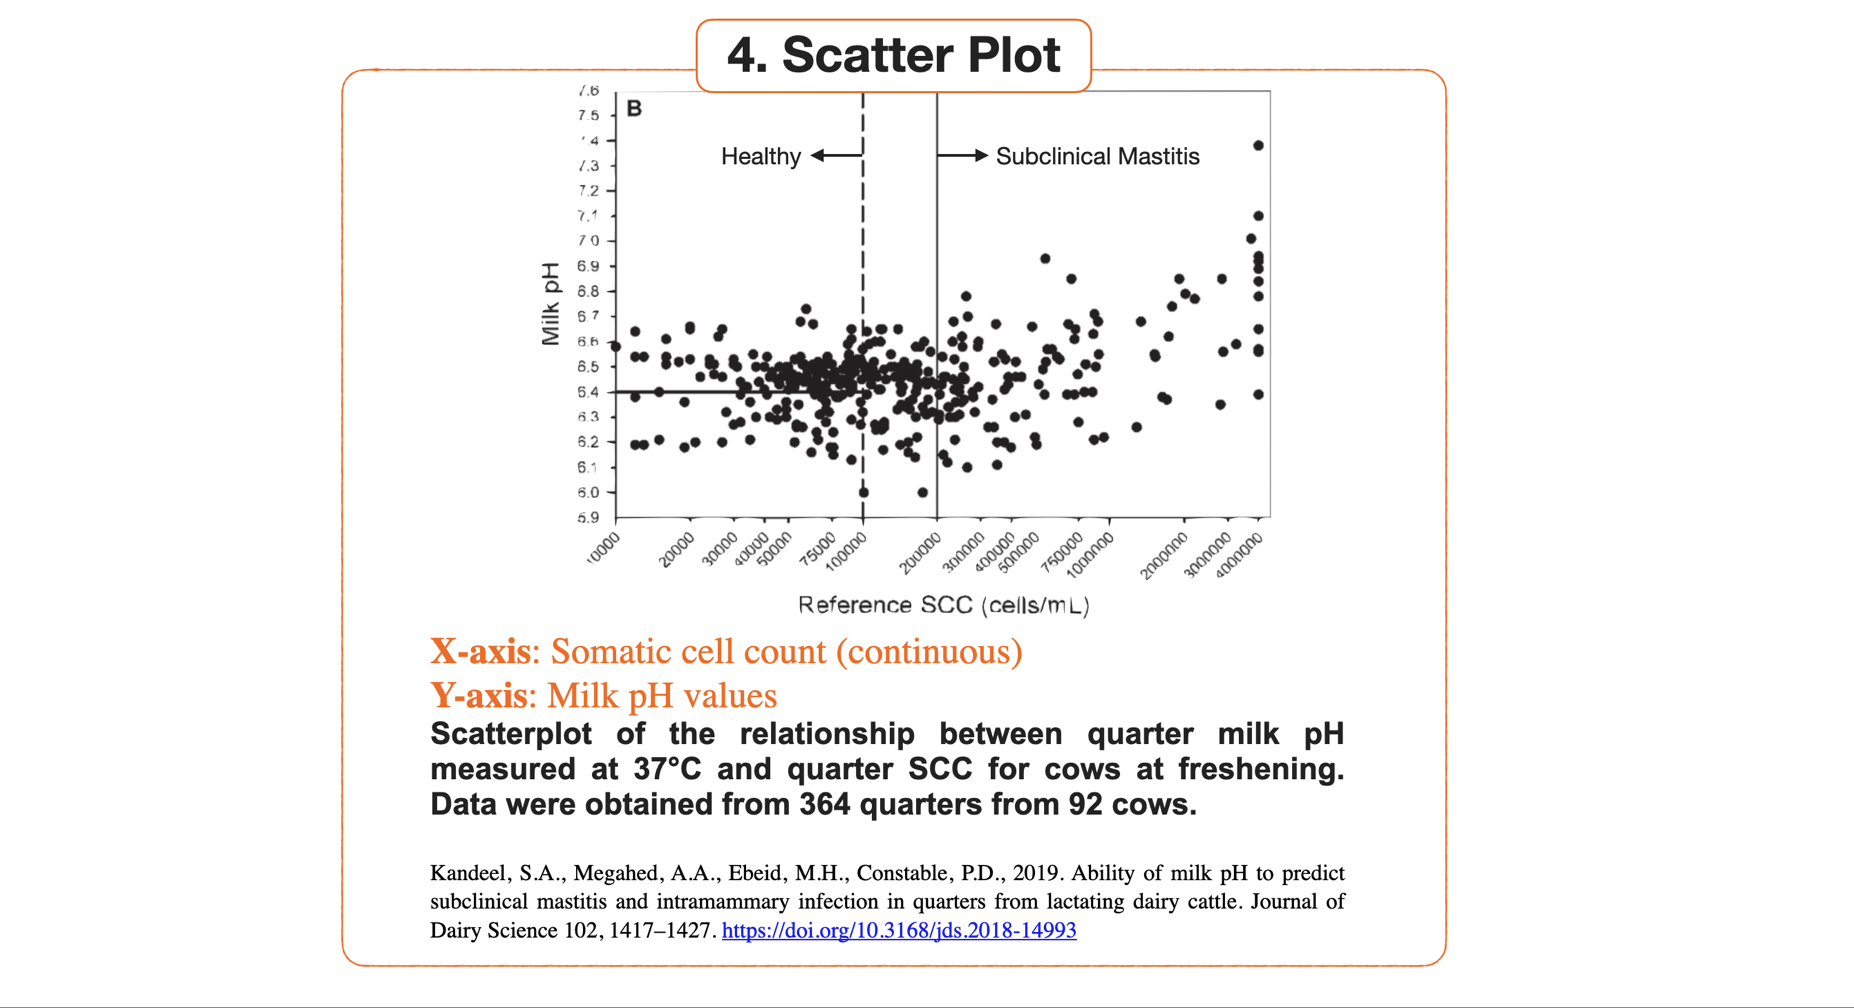
4. Scatter Plot (Relationship between two variables)
Alternatively, a scatter plot is a better choice for displaying the relationship between two variables when the sequential nature of the x-axis variable is either absent or not of interest.
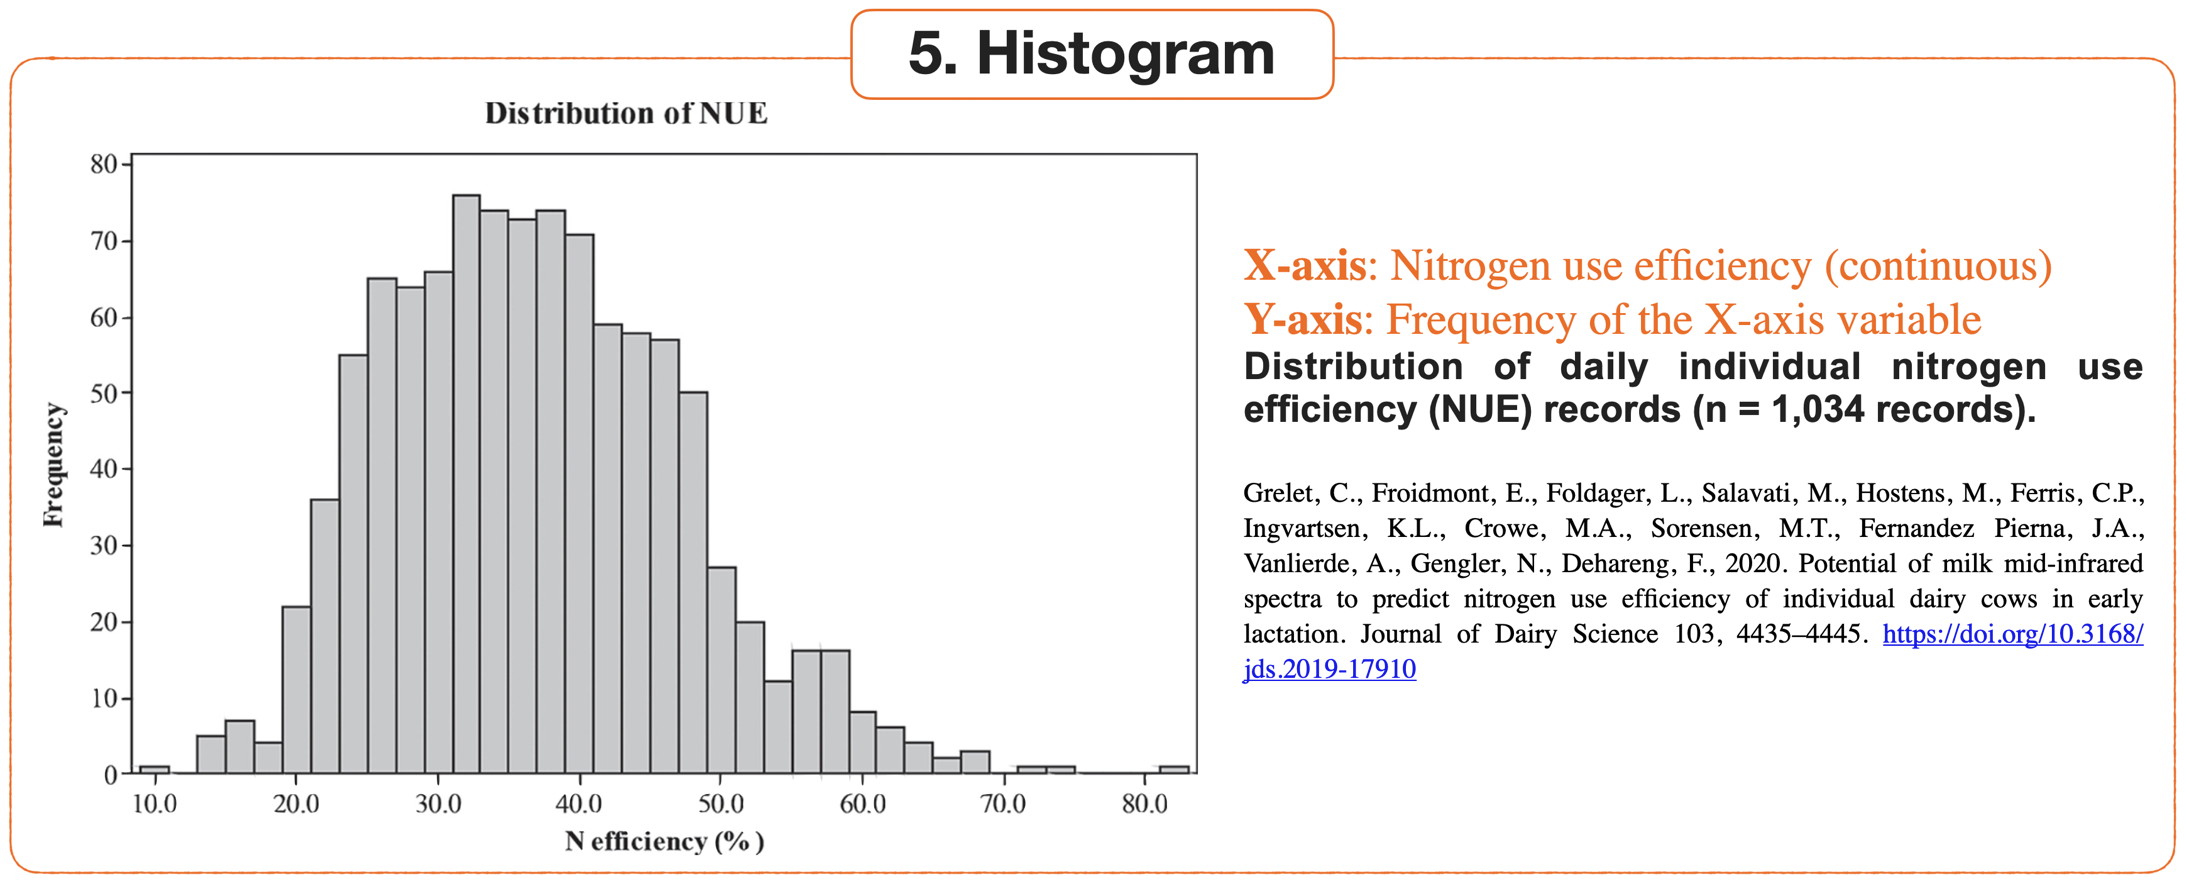
5. Histogram (Distribution of a variable)
Lastly, if we are interested in the distribution of only one variable, a histogram is a good choice.
D. Visualization in Excel
Line Chart
Bar Plot
Box Plot
E. Exercise
Mark the x-axis and y-axis variables, and determine which types of figures best examine the following hypotheses:
Diet has no significant effect on body weight 21 days after hatching.
The grower and starter phases show no difference in daily weight gain.
Sow parity number has no correlation with litter size.